

What win rate means and when to use it
Basic proportion definition
Win rate is the proportion of successful outcomes out of the total number of evaluated decisions, the same mathematical form used for accuracy in model evaluation. In prediction and analytics contexts you compute it as wins divided by the number of completed, evaluable attempts; this equivalence to accuracy is the baseline convention used in modern model-evaluation guidance and documentation, which helps keep reporting consistent across sports and prediction tasks. For a simple arithmetic example, if you have 30 correct forecasts out of 50 completed forecasts the win rate is 30 ÷ 50, or 60 percent, which is the same calculation a classification task would call accuracy. scikit-learn accuracy documentation
When win rate is the right metric
Use win rate when each decision or game is a comparable trial and you want a single-number summary of success frequency. It is appropriate for evaluating forecasts, head-to-head match outcomes, or any series of binary results where events can be classified as wins or losses and where incomplete or voided events are handled consistently. If outcomes are graded, ordinal, or carry varying values you may prefer other metrics, but for straightforward success-versus-failure evaluation win rate remains the simple, interpretable option.
When preparing reports, state whether you treated ties, overtime results, or voided events as part of the denominator; doing so upfront makes results reproducible and prevents misinterpretation when readers compare numbers across competitions or datasets. Many sport rulebooks and model-evaluation guides explicitly define how to count special outcomes, making it important to follow the governing definition for the context you are reporting.

Counting rules: wins, ties, losses and voids
How to count draws and ties
A common convention when ties are possible is to count each tie as half a win and half a loss, giving a winning-percentage formula of wins plus one half of ties divided by total games. This draws-as-half rule is widely used where draws are an official result and provides a continuous measure between full win and full loss that many statisticians and competitions accept. FIDE Laws of Chess
Some competitions instead exclude ties entirely from the calculation and compute winning percentage as wins divided by wins plus losses. That approach is common in leagues that rarely record ties or in standings systems that define the percentage this way; if you replicate a league's official standings you must apply the league definition verbatim. MLB glossary winning percentage
See the FundedPlays Challenges page for challenge rules and requirements
When you adopt a counting convention for ties, record it clearly with your summary and use the same rule across the dataset so comparisons remain meaningful.
When to exclude events (voids, abandoned games)
Abandoned, voided, or otherwise unevaluable matches should normally be removed from the denominator unless the competition specifically assigns a result for such cases. Treating only completed and evaluable decisions as the basis for your percentage avoids bias from events that do not reflect a contest outcome. IFAB Laws of the Game 2024/25
Decide and document how you will treat competition-specific edge cases such as matches awarded administratively, cancelled fixtures, or fixtures replayed under different rules. Consistency in this preprocessing step is as important as the formula you choose, because mixed handling of voids across seasons or regions will produce non-comparable win-rate figures.
Step-by-step: computing win rate and variants
Standard formula
The simplest formula is wins divided by total evaluated decisions, often written as wins ÷ N where N is the count of completed attempts. That standard approach mirrors the accuracy definition in classification tasks and is the default when outcomes are strictly win or loss with no ties. For example, if you record 18 wins from 30 completed games the win rate is 18 ÷ 30 = 0.6, or 60 percent. scikit-learn accuracy documentation
Formula when draws count as half
When you treat draws as half a win and half a loss use the formula (wins + 0.5 × ties) ÷ total games. This is simple to compute in a spreadsheet or script: add wins and half the number of draws, then divide by the total number of matches included. A worked numeric example: with 14 wins, 6 draws and 20 total games the calculation is (14 + 0.5×6) ÷ 20 = (14 + 3) ÷ 20 = 17 ÷ 20 = 0.85, or 85 percent. FIDE Laws of Chess
League-specific formulas (example: MLB)
Some leagues define winning percentage without ties by using wins divided by the sum of wins and losses, effectively excluding ties from the denominator. Use this MLB-style formula when replicating that league's standings or when the governing rules specify it. In practice if a team has 90 wins, 72 losses and 0 ties, the winning percentage is 90 ÷ (90 + 72) = 90 ÷ 162 = 0.556. MLB glossary winning percentage
Before computing a league-specific percentage, confirm how the league treats extraordinary cases such as suspended games, matches awarded by forfeit, or matches decided in shootouts; those definitions determine whether an event is a win, a loss, a tie, or excluded from the denominator.
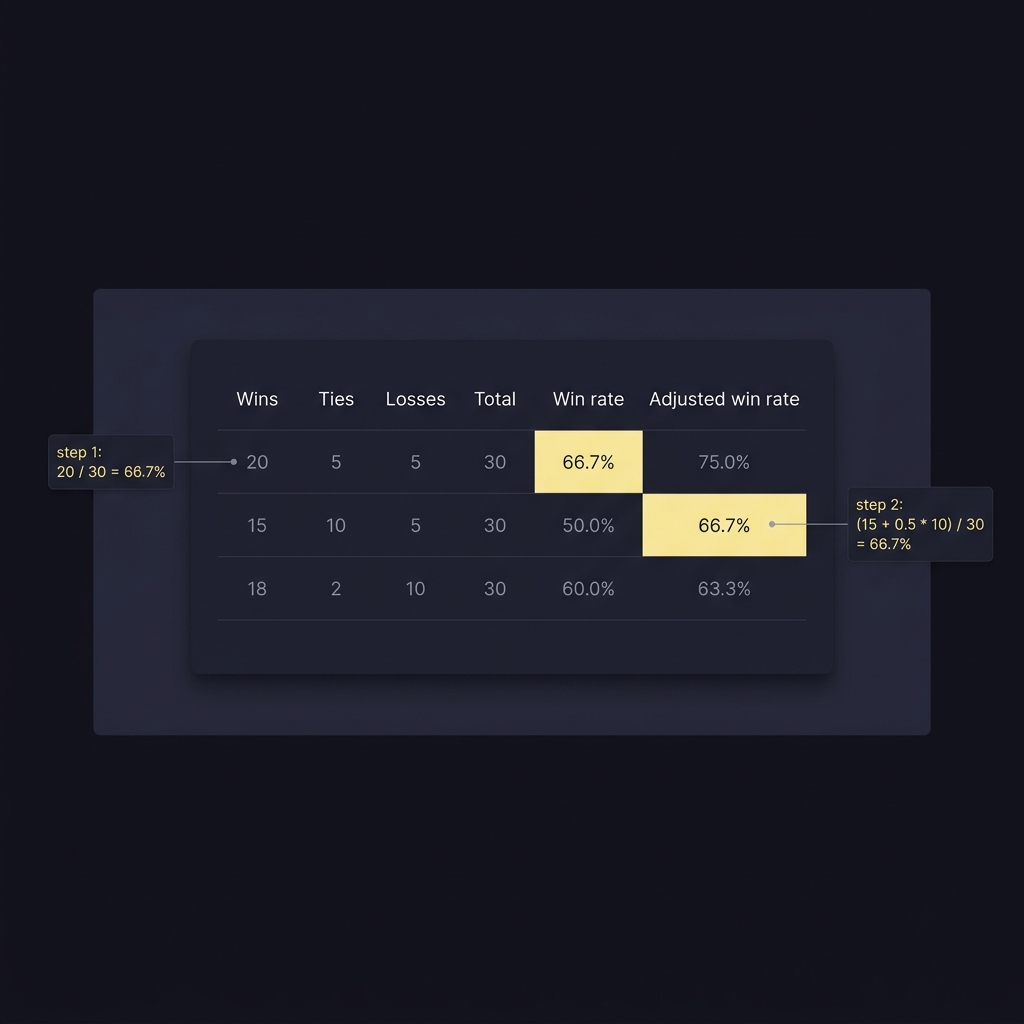
Decide and document how you will treat competition-specific edge cases such as matches awarded administratively, cancelled fixtures, or fixtures replayed under different rules. Consistency in this preprocessing step is as important as the formula you choose, because mixed handling of voids across seasons or regions will produce non-comparable win-rate figures.
Uncertainty, sample size and confidence intervals
Why small samples are volatile
Observed win rates from small samples are inherently noisy, and point estimates alone can mislead readers about likely true performance. When N is small a single additional win or loss shifts the percentage substantially, so reporting a confidence interval alongside the point estimate communicates uncertainty and reduces overinterpretation. Statistical handbooks and modern libraries emphasize this practice to make win-rate reporting more honest and reproducible. NIST e-Handbook on binomial proportions For more background see the binomial proportion confidence interval.
Two interval estimators that perform reliably for binomial proportions are the Wilson interval and the exact Clopper Pearson interval; both are preferred over the naive Wald interval, which can give poor coverage for many sample sizes and proportions. Practical implementations of these intervals are available in statistics libraries and are straightforward to include in reporting pipelines. See a practical explanation of the Wilson interval and a comparative study of confidence intervals for more detail. statsmodels proportion_confint documentation
Compute proportion and act as a placeholder for CI code
Use library functions for Wilson or Clopper Pearson
When you present an interval, show the method name and the sample size so readers can assess how much trust to place in the point estimate. If you use library functions, include the exact function call or snippet in an appendix or reproducible notebook so others can validate your numbers.
Deciding what counts: rules and edge cases
Sport-specific exceptions
Follow official competition rules for edge cases rather than applying a single ad hoc rule, because rulebooks often treat extraordinary outcomes in sport-specific ways. For example, matches decided by penalty kicks after extra time are recorded as draws in many official soccer records; if you count a penalty-kick decision as a win you will diverge from official statistics unless you document the difference. IFAB Laws of the Game 2024/25
Similarly, some competition rulebooks assign results for abandoned fixtures, replayed matches, or administratively awarded outcomes. Before calculating win rate for a dataset that mixes seasons or competitions, map each recorded outcome to a consistent classification and record the mapping rules you used so others can reproduce your analysis.
Consistent classification for analyses
Create a short internal rule set that you apply to raw match records: for example, exclude clearly voided events, treat shootout-decided knockouts according to the league rule, and record ties either as half wins or as excluded depending on the governing definition. Applying such a rule set to the full dataset in a preprocessing step prevents inconsistent denominators and makes your win-rate figures comparable across time and segments. See how Funded Plays evaluates for an example mapping approach. scikit-learn accuracy documentation
Document the preprocessing code, include a summary table of excluded events, and version-control the mapping rules so future reviewers can see exactly how the denominator was constructed. This small amount of bookkeeping pays off when you or others revisit the analysis months later.

Common errors to avoid when reporting win rates
Mixing different denominators
A frequent mistake is mixing denominator rules across rows, for example counting ties in some seasons and excluding them in others. That practice produces noncomparable percentages and misleads readers who expect a single definition of winning percentage. Correct the problem by reprocessing earlier rows to the chosen convention and reporting both the original league definition and your harmonized approach. FIDE Laws of Chess
Another common error is including abandoned or administratively decided events without noting them, which biases the denominator and can either inflate or depress the reported win rate depending on how those events were recorded in source logs. Excluding voided matches from the denominator is the safer default unless the governing rules say otherwise. IFAB Laws of the Game 2024/25
Use a clear counting convention for ties and voids, compute wins relative to the defined denominator, and report sample size plus a robust confidence interval so others can reproduce and assess the estimate.
Overinterpreting small samples
People often treat a short run of results as definitive; avoid that trap by reporting confidence intervals and sample sizes rather than only the point estimate. Showing the Wilson or Clopper Pearson interval alongside the win rate gives readers a clear sense of uncertainty and prevents overstated claims of skill or trend. statsmodels proportion_confint documentation
If you find an unexpectedly high or low win rate on a small sample, flag it as tentative, describe any selection effects that could explain the pattern, and recommend collecting more data before drawing firm conclusions.
Worked examples: sports and model-evaluation scenarios
Soccer example with draws counted half
Suppose a soccer manager evaluates a short season with 10 wins, 5 draws and 7 losses, and chooses the draws-as-half convention. Using the formula (wins + 0.5 × ties) ÷ total games the computation is (10 + 0.5×5) ÷ 22 = (10 + 2.5) ÷ 22 = 12.5 ÷ 22 ≈ 0.568. Make sure to state that draws were treated as half wins and to report the sample size of 22 matches so readers understand the context. FIDE Laws of Chess
Baseball example (MLB-style)
For baseball, where winning percentage is commonly defined as wins divided by wins plus losses, imagine a team with 88 wins, 74 losses and no ties. The calculation is 88 ÷ (88 + 74) = 88 ÷ 162 ≈ 0.543. If ties appear in your dataset for a league that normally excludes them you must decide whether to reclassify or to follow the league glossary definition when presenting standings. MLB glossary winning percentage
Prediction model accuracy example
For a forecasting experiment with 1,000 completed predictions where 620 are correct, compute the win rate as 620 ÷ 1000 = 0.62. Exclude predictions that could not be evaluated because the underlying event was voided or cancelled, and note the exclusion in the experiment log. When publishing results, include a confidence interval computed with a robust method such as Wilson or Clopper Pearson to indicate the likely range of the true success probability. scikit-learn accuracy documentation
Reporting win rate: transparency checklist and closing
What to display with a win rate
Always show the chosen counting convention for ties and penalties, the sample size used to compute the rate, and a confidence interval computed with a robust method. This minimal set of disclosures makes a win-rate statement reproducible and helps readers judge whether the sample is sufficient to support the conclusion. statsmodels proportion_confint documentation

Quick checklist for reproducible reports
Checklist items to include with any published win rate: counting convention for ties and penalties, how abandoned or voided events were handled, the exact denominator and sample size, and a named confidence-interval method. Recording the preprocessing steps and any exceptions ensures that numbers remain verifiable over time. scikit-learn accuracy documentation For examples and further reading see our blog.
Follow official competition rules where they exist, report uncertainty rather than only point estimates, and keep your data and code organized. Visit Funded Plays for resources and examples.
Either count each draw as half a win using (wins + 0.5×ties) ÷ total games, or follow a league's official rule that may exclude ties; state the chosen convention.
No, exclude abandoned or voided events unless the governing competition explicitly assigns them a result; document any exclusions used.
Prefer the Wilson interval or the exact Clopper Pearson interval over the naive Wald interval, especially for small samples.
References
- https://scikit-learn.org/stable/modules/model_evaluation.html#accuracy-score
- https://handbook.fide.com/chapter/E012024
- https://www.mlb.com/glossary/standings/winning-percentage
- https://downloads.theifab.com/ifab/downloads/laws-of-the-game-2024-25?l=en
- https://www.itl.nist.gov/div898/handbook/prc/section2/prc241.htm
- https://www.statsmodels.org/stable/generated/statsmodels.stats.proportion.proportion_confint.html
- https://en.wikipedia.org/wiki/Binomial_proportion_confidence_interval
- https://statisticsfundamentals.com/confidence-intervals/wilson-score-interval/
- https://pmc.ncbi.nlm.nih.gov/articles/PMC6690503/
- https://www.fundedplays.com/blogs/how-fundedplays-evaluations-work
- https://www.fundedplays.com/blogs
- https://www.fundedplays.com
- https://www.fundedplays.com/challenges