
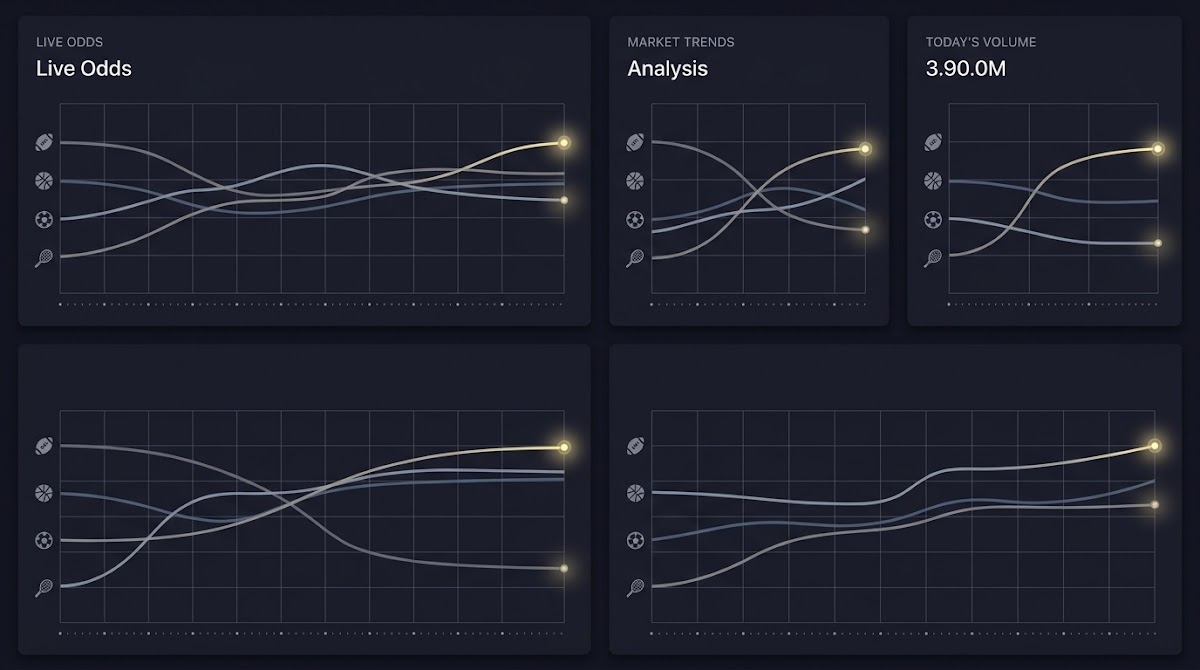
How to Build a Line-Movement Journal: definition and why it matters
How to Build a Line-Movement Journal begins with a simple idea: record how odds change over time so you can see whether your timing and model inputs are capturing value. A line-movement journal is a structured record that tracks opening odds, timestamped snapshots during the market life, and the closing odds that sellers or books post before an event starts. This focus on odds history complements a standard betting journal that records stakes and outcomes by adding market context and execution timing.
The journal’s purpose is practical. By keeping timestamped entries of opening line, mid-market snapshots, and closing line you gain a clearer picture of when value was available, how the market reacted to news or staking, and whether your decisions beat or missed closing-line value. That is the core difference between outcome-only tracking and a line-movement approach: the latter measures how well you read the market and whether you captured the best available odds for your idea.
Start the journal with the FundedPlays template for structured capture
If you want a ready-to-edit example, download the starter spreadsheet template in the templates section and adapt the columns to your preferred market types; it will help you begin capturing line movement in under an hour.
Common use cases include testing a new model against market moves, documenting how news items affect lines, and measuring the effect of your timing when placing forecasts during a challenge. Tracking implied probability alongside odds lets you compare model predictions to market-implied expectation and quantify closing-line value in a simple, repeatable way.
For anyone participating in structured prediction challenges or practicing disciplined forecasting, a line-movement journal surfaces practical opportunities to improve. It highlights whether early or late action tends to work better for the leagues and market types you follow, and it creates a record you can audit over weeks and months.
What a line-movement journal is
A line-movement journal records the market lifecycle for a selection of events. At minimum it captures event metadata, an opening line, one or more mid-market snapshots with timestamps, and a closing line. It may also store your forecasted probability, stake, and the result. The goal is to build a timeline that ties your decision to the prevailing market at the time you acted.

How it differs from a simple bet tracker
A simple bet tracker often lists bets, stakes, and outcomes. A line-movement journal keeps that information but adds the sequence of the market around each action. That extra layer of context lets you separate poor predictions from poor execution. If your model is right but you consistently take lines that worsen before close, the journal will show you where execution lost edge.
Why tracking line movement improves predictive skill
Tracking line movement teaches practical habits that matter for consistent forecasting. Markets move because of new information, money flow, and bookmaker adjustments. By writing down those moves you expose patterns that a pure outcome log misses, such as when lines drift on public sentiment or tighten quickly when sharp accounts change stakes.
How market moves reveal information
When a line shifts it encodes a mix of information and sentiment. A sudden tightening shortly after an injury report may reflect informed money, while a gradual drift could reflect a steady public shift. Recording the timing and magnitude of moves helps you distinguish between information-driven changes and surface-level public patterns.
key features to look for in an odds tool
prioritize timestamp accuracy
What tracking teaches about timing and market sentiment
Systematic tracking exposes whether you tend to act before or after informative moves and whether that habit helps your edge. For example, if your entries often precede large tightening that improves price for others, you may be missing value by acting too early. Conversely, if you repeatedly bet after drift that worsens price, you are paying a timing tax. The journal turns these tendencies into measurable patterns you can test.
Keeping this kind of log supports better discipline. When you can point to the journal and show that waiting two hours on average improves closing-line value for a given market, that is a defensible, data-driven rule rather than an intuition.
Data sources and tools to capture line movement
Start by deciding how precise you need your snapshots to be. Sources range from manual screenshots and recorded odds to automated API pulls and odds aggregator feeds. Each approach trades off between effort, cost, and precision. Manual snapshots are low cost and simple, automated APIs scale better for volume.
Where to get opening, live and closing odds
Opening odds often come from the first available market posting on a chosen book or aggregator. Live odds can be captured at fixed intervals or event-driven timestamps. Closing odds should be the last publicly available price before event start. Make sure you capture the source of each quote so you can compare across books and avoid mixing cross-source artifacts.
Start simply: set up a minimal spreadsheet with columns for event id, opening odds, snapshot times and odds, closing odds, stake, and outcome; capture the first 20 events and run a basic closing-line comparison to see what timing works for you.
APIs, odds aggregators, and manual snapshot options
APIs let you schedule pulls at precise intervals and store timestamped records, which is ideal if you plan to analyze many events or build dashboards. Odds aggregators provide comparative views across books but may normalize or lag raw book listings. Manual snapshots are useful for low-volume practitioners who prefer a simple spreadsheet workflow. Decide early whether timestamp fidelity or ease of use is the priority, and pick a workflow that matches your expected volume.
Practical note on frequency: point-in-time snapshots capture the market at the moments you care about and require less storage, while continuous streams provide the richest view but increase complexity for storage and processing. For most users a mix of scheduled snapshots plus event-driven updates when major news appears strikes a good balance.
How to Build a Line-Movement Journal: designing the template

A clear template is the core of a usable journal. At a high level include: event metadata, odds snapshots, personal action, context notes, and post-event outcome. These sections make it easy to sort and filter later when you test hypotheses about timing or market sensitivity.
Choose a format based on expected volume. A spreadsheet is flexible and quick for small volumes. A lightweight database or cloud sheet works for medium volume and supports automated ingestion. For large volumes, a proper relational store with incremental API ingestion is preferable. The key is to keep column names consistent so you can aggregate later without manual cleaning.
Core sections of the journal
Make the core sections explicit and brief so you can record entries quickly. Suggested headings include event id, league, start time, market type, opening odds, snapshots with timestamps, closing odds, stake, expected value estimate, and result. Add a short free-text field for rationale and any contextual notes like injury or lineup updates.
Choosing a format: spreadsheet, database, or specialized app
For most users starting out a spreadsheet is the fastest route. It supports sorting, simple formulas for implied probability, and CSV export. If you expect dozens of events per day, consider a database or cloud sheet with an automated API feed to reduce manual work. Specialist apps can help with visualization but are not required to get value from line movement tracking.
When picking a format, prioritize consistent naming for market types and book identifiers so you avoid mismatched rows later. This upfront work reduces data hygiene effort during analysis and makes your first review more productive.
Core fields to record and why each matters
Decide on essential fields and stick to them. Essential fields should include event ID, league, market, opening odds, timestamped odds snapshots, closing odds, stake, and result. These fields let you compute closing-line value, evaluate timing buckets, and analyze ROI by market type.
Context fields explain why you acted the way you did. Record news items, injuries, the line source, and a short note on your reasoning. These qualitative notes help later when you see repeated patterns linked to specific event types or information triggers.
Essential fields every journal must include
At minimum capture event metadata, market type, opening odds, at least one mid-market snapshot with timestamp, closing odds, stake, and outcome. Also capture a predicted probability or model output if you use one. With these fields you can compare market-implied probability to your forecast and quantify closing-line value.

Optional fields that add analytic power
Advanced users can add fields such as liquidity indicators, public handle estimates, model predicted line, and bet size if available. These fields let you investigate whether moves are liquidity-driven or reflect sharps. They also support deeper segmentation when testing patterns by market or timing.
When you add optional fields, keep defaults consistent so automated imports align with existing columns. That reduces the need for manual cleaning and preserves the ability to run automated comparisons later.
Daily workflow: how to capture line moves without getting overwhelmed
Adopt a routine that matches your volume and time. Low-volume users benefit from a morning checklist that records opening lines and a pre-game snapshot routine for events they plan to follow. High-volume users should automate scheduled snapshots and set alerts for large moves or news triggers.
Suggested morning checklist: identify events to monitor, record opening lines for those events, note any scheduled news items that might affect odds, and set alarms or reminders for the pre-game snapshots. This short routine creates a disciplined baseline you can improve over time.
A simple routine for low-volume users
For a single-person workflow keep entries minimal. Record the opening line, your planned stake and reason, and the closing line after the event. Add a short note if a late injury or lineup change occurred. Batching entries once per day keeps effort low while preserving the ability to test timing across a meaningful sample.
An automated workflow for higher volume
High-volume users should schedule API pulls at fixed intervals and implement incremental snapshots. Use simple scripts to append new rows to a cloud table and tag rows with ingestion timestamps. Alerts can be configured for move magnitude thresholds so you only inspect events that shifted materially.
Do: use templates and scripts to reduce manual entry. Dont: delay recording until after the event because that loses timing fidelity. If manual work is unavoidable, copy timestamps from the source to preserve the sequence of events.
How to interpret common line-movement patterns
Understanding typical patterns helps you form hypotheses to test. Common patterns include steam moves, late shifts, drift, and line creep. Each pattern carries different implications about information flow and public sentiment, and the journal helps you see which patterns are predictive for your markets.
Documenting patterns in your journal lets you establish simple heuristics. For example, a steam move that occurs repeatedly right after a specific news channel may indicate a reliable source of information for that market. A steady drift across days may reflect public bias rather than information-driven money.
Typical patterns and what they suggest
Steam moves are rapid, large adjustments that often indicate heavy action from sharp accounts. Late shifts occur close to event start and may reflect last-minute information or late liquidity. Drift is a gradual change that can reflect public sentiment or loosening value. Line creep is a subtle, persistent weakening or strengthening of a side over time.
How to test whether a pattern is predictive for you
To test a pattern, isolate a subset of entries that match the pattern and compare performance metrics such as closing-line value and ROI against a baseline. Use timing buckets for granularity. Small samples are common, so treat early results as indicative rather than conclusive and expand the test window before changing rules.
Keep tests simple: define the pattern precisely, pick the time window to evaluate, and calculate a few core metrics. If the pattern consistently correlates with improved closing-line value or better ROI across different samples, it warrants further attention.
Decision criteria: using your journal to choose when to act
Translate journal findings into objective rules. Define triggers such as a minimum expected value, a threshold of line improvement, or a preferred timing window relative to event start. Rules turn a descriptive journal into a decision-making tool you can follow under pressure.
When creating rules, prefer measured thresholds that are easy to check quickly. For example, require a specific minimum of expected value or a guaranteed line improvement window before placing a trade. These objective criteria reduce emotional decisions.
Formalizing rules from your data
Start with conservative rules you can test in simulation or with small stakes. A rule might require that expected value exceed a baseline and that the entry occurs within a timing bucket shown to outperform in your logs. Record each rule application in the journal so you can evaluate rule performance over time.
Combining model output and market movement
Merge your model predicted line with market snapshots to generate signals when the market offers pricing below your predicted probability. Use the journal to log whether acting on those signals consistently produced positive closing-line value over a test period. If it does, gradually increase test stakes while continuing to monitor out-of-sample performance.
Simulated testing is a low-cost way to validate rules before risking more. Keep rules narrow initially and broaden them only after you have stable evidence from multiple windows.
Common mistakes and how to avoid them
Journaling is useful only when the data are clean and the review process is honest. Common errors include missing timestamps, inconsistent market labels, and not recording the closing line. Behavioral pitfalls include hindsight bias, cherry-picking wins, and overfitting to small samples.
Practical remedies start with standardizing inputs. Predefine market type labels, require a closing-line field, and enforce a timestamp format. Also establish a review cadence and a pre-commit to metrics you will use so that post-hoc changes to metrics are minimized.
Data hygiene mistakes
Missing or inconsistent data undermines analysis. Use templates and ingestion scripts that validate required fields on entry. If you must enter rows manually, use dropdowns for market types and book identifiers to avoid typos that break grouping and filtering later.
Cognitive and emotional traps
Hindsight bias and selection bias are persistent risks. Avoid changing definitions after you see outcomes. Use predefined review templates and commit to a cadence so that performance reviews focus on reproducible metrics rather than anecdote. When a pattern looks promising, expand the sample before making it a rule.
Practical examples and ready-to-use templates
Two templates make a good starting set: a minimal spreadsheet for quick entry and an expanded template for deeper analysis. The minimal layout includes columns for date, event id, league, market, opening odds, snapshot time and odds, closing odds, stake, outcome, and a short note. The expanded version adds model line, expected value, liquidity flag, and an optional public handle estimate.
Example entry A: opening odds posted at a timestamp, you enter when the market is unchanged, you note a small stake and the result. The post-event review shows whether the closing line moved in your favor and how much closing-line value you captured. Example entry B: a mid-market tightening after a lineup confirmation, you logged a timestamped snapshot showing a meaningful move. The review shows if acting on that tightening would have improved long-term edge for similar events.
A simple spreadsheet template walkthrough
Build the minimal sheet with clear column headings and simple formulas to convert odds to implied probability. Use conditional formatting to highlight when the closing line is better or worse than the entry line. Save the workbook as CSV for compatibility with basic analysis tools.
Example entries and what to learn from them
Annotate two rows showing a late shift and a steam move. For each row, write a one-sentence lesson such as why timing mattered or how a news item correlated with the direction of the move. These short annotations speed up your review and make it easier to spot repeated signals during weekly checks.
Advanced techniques: automating analysis and integrating models
Automation scales the journal without changing its core purpose. Use scheduled API pulls and incremental snapshots to populate a simple database. Index by event id and timestamp so you can reconstruct the market timeline for any event. ETL steps should include basic validation and normalization of market labels.
Store model predicted lines alongside market snapshots so you can compute real-time expected value and flag cases where the market deviates from your forecast. That merged dataset becomes the basis for signal generation and automated alerts when a threshold is met.
Basic automation scripts and database schemas
Keep schemas simple: an events table with metadata, a snapshots table with timestamp and odds, and a decisions table logging your actions. This separation keeps queries efficient and makes it easier to build simple performance dashboards without overcomplicating the data model.
How to merge model predictions with market data
When your model produces a predicted probability, convert it to an implied line in the same format as your market odds and store it with a timestamp. Comparing predicted line to snapshot line yields a simple edge metric you can track over time. Use this metric to prioritize events for manual review or automated signal generation.
Keeping discipline: review cadence and continuous improvement
Structure reviews so they are short, focused, and regular. Weekly reviews should check tactical items like inventory of unmatched events and any recurring data issues. Monthly reviews look for emerging patterns in closing-line value and whether timing buckets are shifting. Quarterly reviews consider structural changes such as adding markets or changing snapshot frequency.
Key metrics to track include closing-line value, win rate by timing bucket, ROI by market, and sample sizes needed for confidence. Commit to a fixed review template that lists these metrics so comparisons across months remain consistent.
How often to review and what metrics to track
Weekly reviews are for quick corrections and tactical adjustments. Monthly reviews examine sample-level performance and whether rule changes are warranted. Quarterly reviews are for strategic shifts and assessing whether your journal approach needs refinement. Stick to the metrics you predefined to avoid post-hoc rationalization.
Using the journal for honest performance reviews
Honest reviews depend on consistent data and predeclared metrics. When a rule or pattern looks promising, expand the test window before adopting it broadly. Keep decisions incremental and reversable to avoid large position sizes based on untested observations.
Two templates make a good starting set: a minimal spreadsheet for quick entry and an expanded template for deeper analysis. The minimal layout includes columns for date, event id, league, market, opening odds, snapshot time and odds, closing odds, stake, outcome, and a short note. The expanded version adds model line, expected value, liquidity flag, and an optional public handle estimate.
Example entry A: opening odds posted at a timestamp, you enter when the market is unchanged, you note a small stake and the result. The post-event review shows whether the closing line moved in your favor and how much closing-line value you captured. Example entry B: a mid-market tightening after a lineup confirmation, you logged a timestamped snapshot showing a meaningful move. The review shows if acting on that tightening would have improved long-term edge for similar events.
A simple spreadsheet template walkthrough
Build the minimal sheet with clear column headings and simple formulas to convert odds to implied probability. Use conditional formatting to highlight when the closing line is better or worse than the entry line. Save the workbook as CSV for compatibility with basic analysis tools.
Example entries and what to learn from them
Annotate two rows showing a late shift and a steam move. For each row, write a one-sentence lesson such as why timing mattered or how a news item correlated with the direction of the move. These short annotations speed up your review and make it easier to spot repeated signals during weekly checks.
Advanced techniques: automating analysis and integrating models
Automation scales the journal without changing its core purpose. Use scheduled API pulls and incremental snapshots to populate a simple database. Index by event id and timestamp so you can reconstruct the market timeline for any event. ETL steps should include basic validation and normalization of market labels.
Store model predicted lines alongside market snapshots so you can compute real-time expected value and flag cases where the market deviates from your forecast. That merged dataset becomes the basis for signal generation and automated alerts when a threshold is met.
Basic automation scripts and database schemas
Keep schemas simple: an events table with metadata, a snapshots table with timestamp and odds, and a decisions table logging your actions. This separation keeps queries efficient and makes it easier to build simple performance dashboards without overcomplicating the data model.
How to merge model predictions with market data
When your model produces a predicted probability, convert it to an implied line in the same format as your market odds and store it with a timestamp. Comparing predicted line to snapshot line yields a simple edge metric you can track over time. Use this metric to prioritize events for manual review or automated signal generation.
Keeping discipline: review cadence and continuous improvement
Structure reviews so they are short, focused, and regular. Weekly reviews should check tactical items like inventory of unmatched events and any recurring data issues. Monthly reviews look for emerging patterns in closing-line value and whether timing buckets are shifting. Quarterly reviews consider structural changes such as adding markets or changing snapshot frequency.
Key metrics to track include closing-line value, win rate by timing bucket, ROI by market, and sample sizes needed for confidence. Commit to a fixed review template that lists these metrics so comparisons across months remain consistent.
How often to review and what metrics to track
Weekly reviews are for quick corrections and tactical adjustments. Monthly reviews examine sample-level performance and whether rule changes are warranted. Quarterly reviews are for strategic shifts and assessing whether your journal approach needs refinement. Stick to the metrics you predefined to avoid post-hoc rationalization.
Using the journal for honest performance reviews
Honest reviews depend on consistent data and predeclared metrics. When a rule or pattern looks promising, expand the test window before adopting it broadly. Keep decisions incremental and reversable to avoid large position sizes based on untested observations.
Conclusion: next steps for building your first line-movement journal
To start in under an hour, set up a minimal spreadsheet, capture opening lines for your first 20 events, and record a closing line after each event. That quick baseline gives you immediate material to compute simple metrics like closing-line value and timing buckets.
For the first 30 days focus on capturing consistent entries, completing a weekly review, and running a closing-line comparison on the initial sample. Remember that the journal measures trends in your decision-making and execution, not guaranteed outcomes. Use it to learn and to build small, evidence-based rules you can test progressively.
A line-movement journal records timestamped odds snapshots and closing lines in addition to stakes and outcomes, providing market context for execution timing and closing-line comparisons.
Snapshot frequency depends on volume and goals; low-volume users can record opening and pre-game snapshots, while higher-volume users schedule automated pulls or event-driven updates for important moves.
Yes, simulate rules with historical snapshots or use small stakes in live testing to validate behavior before scaling up.