
How to Avoid Overestimating Your Edge, quick orientation
What this article will and will not do
This article, How to Avoid Overestimating Your Edge, focuses on practical, research-backed steps that reduce false positives when evaluating forecasting ideas for sports prediction. It does not promise profits or guarantee outcomes; instead it offers procedures you can embed in a disciplined workflow to test whether a candidate rule has persistent predictive value.
Early on we name the main technical tools you will use: rolling-origin time-series cross-validation and explicit holdouts, multiple-testing correction procedures such as White's Reality Check and SPA, the Probability of Backtest Overfitting framework, and uncertainty estimation with confidence intervals and resampling. These tools form the backbone of an evidence-based validation routine and will be applied to examples and a checklist later.
Use this article as a checklist and as a set of reproducible procedures to include in strategy development. The sections that follow explain each method, show why short tests often mislead, and give concrete steps you can copy into a lab book or an evaluation template. Treat the sequence as a minimum evidence standard before you consider deploying any rule live.
Download the validation checklist for challenge-ready testing
Copy the checklist from the validation section and use it as a standing pre-analysis form before testing new ideas.
Who should read this and how to use the checklist
This guide is aimed at sports analysts, experienced bettors, and anyone taking part in challenge-based platforms who needs to separate short-term luck from an honest edge. If you run many candidate rules, keep many trials, or rely on short backtests, the methods here will help you avoid overconfidence and make better decisions.
The rest of the article is structured so you can jump to the parts you need: definitions and context, a primer on rolling-origin validation and holdouts, pre-specification templates, multiple-testing corrections, PBO diagnostics, uncertainty estimation, and a final checklist to copy into a notebook. You can also browse related posts on our blog.
How to Avoid Overestimating Your Edge, definition and context
What we mean by an "edge" in sports prediction
In this context an "edge" is a persistent predictive ability that yields better-than-baseline forecasting accuracy or excess virtual returns after accounting for realistic costs and sample variability. An edge is not a single lucky run; it should replicate in out-of-sample data and remain robust to reasonable changes in data windows and evaluation metrics.
Why variance, not skill, can masquerade as an edge
Short backtests and small samples often produce apparently strong performance because random variation can create streaks that look like skill. When outcomes are concentrated or heavy-tailed, a few wins or losses can dominate results and make a noisy rule seem reliable. Empirical analyses of online gambling patterns show such concentration and heavy tails, which raises the bar for how much evidence you need before accepting an edge. Patterns of Play report
Another source of apparent edges is the selection effect when many candidate rules are tried and only the best-looking ones are reported. Repeated searching across strategies increases the chance that an apparently high in-sample performance is a fluke rather than a genuine out-of-sample improvement, so selection must be accounted for in evaluation routines.

Why practitioners routinely overestimate an edge
Data snooping, p-hacking, and multiple testing
Testing many candidate models or tweaking rules until one looks good inflates false positives. Econometric methods exist to correct for that kind of data snooping, and they are essential when pick-the-best workflows are used. A Reality Check for Data Snooping
Use time-aware cross-validation, preserve an untouched holdout for final confirmation, correct for multiple testing, estimate PBO for your candidate set, and report confidence intervals so you can distinguish durable performance from short-run variance.
Short-run luck and concentration of outcomes
People remember the winning strategies and forget the many variants that failed, which creates confirmation bias and an inflated sense of skill. In gambling-like data, heavy tails and concentrated outcomes mean short-run luck is common; without proper validation you will mistake variance for a durable advantage. Patterns of Play report
How to Avoid Overestimating Your Edge, rolling-origin cross-validation and holdouts
What rolling-origin CV is and why it matches live deployment
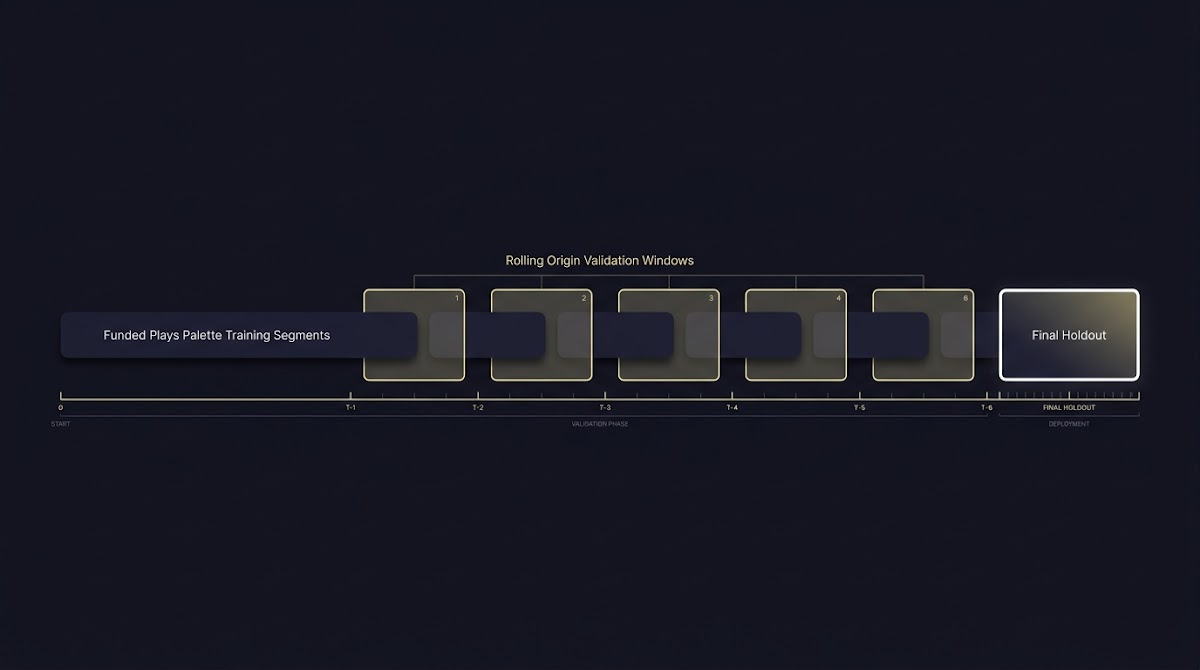
Rolling-origin cross-validation builds training and test folds that respect time order so predictions are always evaluated on data that would have been unseen at the moment of prediction. This prevents look-ahead leakage and gives a closer approximation to how a rule performs in live conditions. The approach and practical options are discussed in detail in time series cross-validation guides. OTexts time series cross-validation guide See a visual guide to the rolling-origin idea here: visual guide.
Practically, rolling-origin means you set a series of cut dates, train on data up to each cut, generate forecasts for the next window, then roll the cut forward and repeat. Aggregating performance across these held-forward windows gives an out-of-sample estimate that accounts for changing data regimes and temporal dependence. For an alternate implementation note see Open Forecast rolling origin.
simple rolling-origin split recipe
move windows forward without overlap
How to choose holdouts and avoid look-ahead bias
In addition to rolling folds you should reserve a final, untouched holdout set for the last confirmation test. Do not peek at this holdout when tuning parameters. A common pattern is: build and tune on rolling folds, adjust only on validation windows, then apply the pre-specified final test on the holdout to confirm performance.
Choose a holdout window that matches the deployment horizon you expect and that is large enough to contain representative events. If your estimates are driven by a few outliers in the holdout, treat that as a signal to revisit sample design rather than as confirmation of robustness.
Pre-specification, analysis plans, and decision rules
Why pre-specification reduces false discoveries
Pre-specifying hypotheses, data cleaning steps, and stopping rules constrains post-hoc choices and reduces the risk of p-hacking. When you define the metric, the evaluation windows, and the acceptance criteria before you see the outcomes, you limit the degrees of freedom that produce spurious findings. The general argument for pre-specification and reproducibility is well documented in methodological literature on research validity. Why Most Published Research Findings Are False
What to include in a simple analysis plan
Your minimal analysis plan should list the hypothesis, the performance metric (for example hit rate, return per event, or Sharpe-like ratio), exact data inclusion and exclusion rules, how you will handle missing data, the rolling fold parameters, and the decision thresholds for acceptance. Also include how you will compute uncertainty and the frequency of revalidation.

For platforms that use structured evaluation, such as funded challenge systems, pre-specification and transparent rules help create a fair, repeatable assessment of skill. If you participate in challenge-based programs, adopt the platform's stated rules into your analysis plan so your tests mirror the live environment. Learn more about how Funded Plays evaluations work: how Funded Plays evaluations work. Also see our main site at Funded Plays.
Multiple-testing corrections, White's Reality Check and Hansen's SPA
The problem multiple testing creates for pick-the-best workflows

When many strategies are tried and the best performer is selected, naive p-values understate the chance that the top result is just noise. Multiple-testing correction adjusts the inference to reflect the number of effective trials, which changes how confident you can be about any apparent winner.
How White's Reality Check and SPA adjust for data snooping
White's Reality Check and Hansen's SPA are bootstrapped tests designed to ask whether any model in your candidate set truly outperforms a benchmark after accounting for the selection effect. They resample residuals to generate a sampling distribution of the maximum performance and provide corrected p-values that reflect data snooping risks. A Reality Check for Data Snooping
Apply these tests when you have dozens or hundreds of candidate rules. If the corrected test fails to reject the null, be skeptical of the pick-the-best result and consider stronger pre-specification or fewer degrees of freedom in your search.
Probability of Backtest Overfitting (PBO), what it measures and how to use it
PBO explained in plain language
PBO measures how often the best in-sample strategy would fail when applied out of sample, given the number of trials and the correlation structure of outcomes. A high PBO means that selection effects are likely driving the apparent success rather than genuine predictive power. The framework formalizes the intuition that repeated trials increase the chance of a spurious top performer. Probability of Backtest Overfitting paper
How to compute and interpret PBO for your strategy set
Computing PBO typically involves simulating or resampling your strategy performance matrix, measuring how often the in-sample best does not remain the best out of sample, and reporting the proportion of failures as the PBO. If PBO is large, treat a high in-sample Sharpe-like statistic with caution and consider narrowing the search or increasing holdout sizes.
Acceptable PBO thresholds depend on your tolerance for risk of being wrong, but a conservative workflow treats PBO above modest levels as a reason to rework or pre-specify more tightly before deployment.
How to Avoid Overestimating Your Edge, quantifying uncertainty with intervals and resampling
Why point estimates mislead and how intervals help
Point estimates, such as a single Sharpe-like number or hit rate, hide the sampling variability that can make results indistinguishable from noise. Reporting confidence intervals shows the range of plausible values and helps you see when a measured edge could be due to chance rather than persistent skill. When intervals are wide relative to the effect size, you do not have a reliable edge. A Reality Check for Data Snooping
Bootstrap and resampling techniques for sports data
Bootstrap methods resample events or residuals to build empirical distributions for your performance metrics. For many sports prediction tasks you can bootstrap by game or event rather than by individual outcomes to preserve temporal structure, then compute interval estimates for your metric of interest. Use resampling both in rolling folds and on the final holdout to characterize uncertainty.
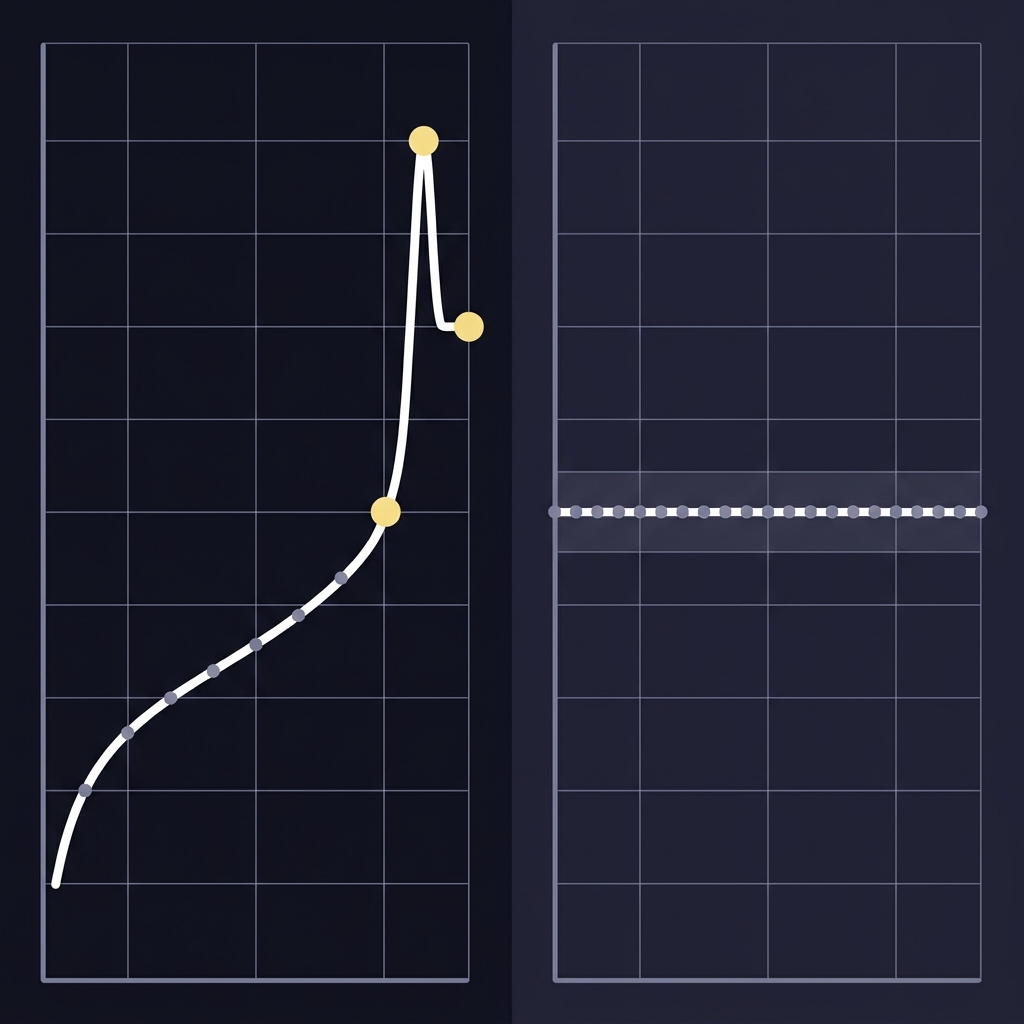
Simple pseudo-procedure: fix your pre-specified rule, resample the evaluation windows or events with replacement many times, compute the metric each time, and report percentiles as a confidence interval. If the lower bound overlaps your benchmark, your apparent edge is not robust.
Heavy tails, concentration, and short-run variance in gambling data
Empirical patterns from large-scale gambling studies
Analyses of real-world online play show outcomes that are not well described by thin-tailed models; instead they exhibit concentration where a small fraction of events or players account for large outcome share. This empirical pattern increases the probability that short backtests will find misleading results unless larger samples or robust methods are used. Patterns of Play report
Implications for strategy evaluation and sample-size planning
Because heavy tails inflate short-run variance, plan for larger holdout and validation windows than you might expect under normal assumptions. Prefer robust summary metrics and monitor the influence of extreme events; if a small number of events drive most of the performance, treat the result skeptically and require further confirmation.
Edge validation checklist, a step-by-step protocol to test a candidate edge
Pre-analysis checklist
Pre-specify the hypothesis: what outcome you predict and the metric you will use. Record the exact data used, inclusion rules, and how you will treat missing or ambiguous events. Set the rolling fold parameters, the final holdout window, the acceptance thresholds for the metric, and how you will compute uncertainty. Include a plan for multiple-testing correction and a PBO check.
Validation steps and go/no-go rules
Validation sequence to follow: 1) Run rolling-origin cross-validation without touching the holdout. 2) Use only the validation folds to tune parameters. 3) Apply multiple-testing correction if you evaluated many variants. 4) Estimate PBO across your candidate set. 5) Run the pre-specified final test on the untouched holdout and compute confidence intervals. Only pass if the holdout result meets pre-defined thresholds, corrected tests do not reject robustness, and PBO is acceptable.
Decision criteria example: require a holdout effect that is directionally consistent with validation folds, a confidence interval that excludes the benchmark at your chosen level, and a PBO below your maximum tolerable rate for false discoveries.
Common mistakes and cognitive traps that inflate perceived edges
Typical statistical errors
Common errors include accidental data leakage from improperly aligned timestamps, look-ahead bias when future information is used in a predictor, and failing to correct for multiple tests. Each of these inflates apparent performance and can be caught with careful data audits and pre-specified routines. A Reality Check for Data Snooping
Behavioral biases to watch for
Behavioral traps include overconfidence, outcome-based selection where you keep only the winning rules, and survivorship bias in reported results. Simple remedies are to log all candidate tests, keep negative results, and use blind holdouts so the temptation to tweak is reduced.
Practical examples and scenarios, applying the checklist
Small-sample prop prediction example
Imagine testing a prop prediction on a limited set of events where only a few outcomes determine profit. An in-sample run may show strong results, but when you apply rolling-origin CV and a forward holdout the effect can disappear because the original run was driven by a few lucky events. Use a larger holdout or fold structure to see whether the effect persists before treating it as a true edge. OTexts time series cross-validation guide For another practical note on cross-validation see TLverse cross-validation notes.
Multiple-strategy selection scenario
When you compare many candidate rules, use SPA or White's test to check whether any winner stands above the rest after selection bias is accounted for. Combine that with a PBO estimate to understand the chance that your best-looking rule is a false positive. If corrected tests do not support the pick, narrow the candidate set and pre-specify fewer variants next time. Probability of Backtest Overfitting paper
Operational rules for live deployment and ongoing monitoring
Minimum evidence before going live
Before live deployment require three checks: the rolling-origin validation shows consistent directionality, the untouched holdout passes your pre-specified threshold, and PBO and multiple-testing corrections do not indicate a high risk of overfitting. Document all steps and store the analysis plan with results for later audit.
Monitoring for degradation and maintenance
After deployment, monitor performance in fixed revalidation windows and compare current statistics to the distribution from your historical resampling. Set thresholds for rollback and automate alerts when metrics drift beyond acceptable bands. Combine these signals with conservative bankroll controls to limit exposure while you investigate possible degradation.
How to Avoid Overestimating Your Edge, conclusion and next steps
Key takeaways
To reduce false positives, use rolling-origin cross-validation and explicit holdouts, correct for multiple testing with methods like White's Reality Check or SPA, estimate PBO when many trials are used, and always report uncertainty with intervals and resampling. These defenses form a practical protocol to keep short-run variance from being mistaken for a durable advantage. Probability of Backtest Overfitting paper
Practical next actions and resources
Start by pre-specifying one hypothesis and running the rolling-origin recipe on it. Add a final holdout, compute a simple PBO diagnostic, and bootstrap the holdout performance to produce confidence intervals. Keep a lab book of all trials and adopt the checklist in this article as a standing pre-analysis form. Visit Funded Plays for more resources.
Trust requires out-of-sample confirmation. Run rolling-origin CV, preserve an untouched holdout, correct for multiple tests, estimate PBO, and check confidence intervals before deploying any rule.
PBO quantifies how often the best in-sample strategy will not perform out of sample. A high PBO means selection likely produced a spurious winner.
No. Strong in-sample metrics can be due to luck or overfitting. Use rolling-origin CV, holdouts, multiple-testing correction, and resampling to verify robustness.
References
- https://www.gamblingcommission.gov.uk/statistics-and-research/publication/patterns-of-play-phase-1-report
- https://onlinelibrary.wiley.com/doi/10.1111/1468-0262.00152
- https://otexts.com/fpp3/tscv.html
- https://www.researchgate.net/figure/A-visual-guide-to-rolling-origin-cross-validation-ROCV-where-the-total-sample-size-T_fig2_349464525
- https://openforecast.org/adam/rollingOrigin.html
- https://journals.plos.org/plosmedicine/article?id=10.1371/journal.pmed.0020124
- https://www.fundedplays.com/challenges
- https://www.fundedplays.com
- https://www.fundedplays.com/blogs
- https://www.fundedplays.com/blogs/how-fundedplays-evaluations-work
- https://jpm.pm-research.com/content/40/5/102
- https://tlverse.org/enar2023-workshop/origami.html