
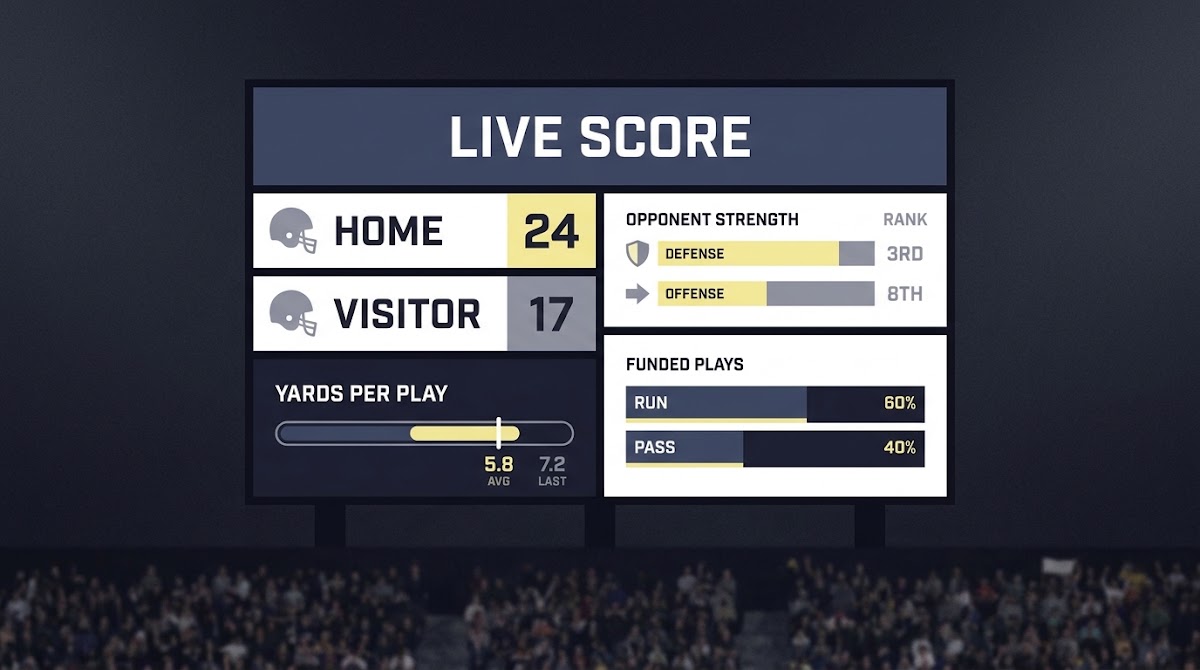
How to Avoid Narrative Traps in College Football: definition and why it matters
What we mean by a narrative trap
A narrative trap happens when a story about a team gains weight beyond the underlying data that supports it. In college football this usually looks like a headline that leans on a single game, a highlight sequence, or a recent result while ignoring baseline context. Framing choices and selective examples can make a thin signal feel decisive, so treating the narrative as a hypothesis to test helps keep analysis honest; this pattern of influence is described in modern framing research Framing Theory overview.
Analysts, fans, and bettors all fall into narrative traps when the incentive is speed over verification. The immediate cycle of social posts and headlines rewards memorable angles, which amplifies recency effects and availability-driven interpretations. Recognizing a narrative trap early lets you avoid costly decision errors by pausing to check definitions, context, and alternative explanations; read more on the Funded Plays blog.
Use a repeatable checklist during the season to test narratives - learn the rules and verify claims on the FundedPlays Challenges page
Save this checklist for live games: define the claim, confirm definitions, adjust for opponents, and run a basic out-of-sample check before sharing conclusions.
Who is affected: fans, analysts, bettors
Fans see narratives as stories that make sense of a result, while analysts are asked to turn those stories into numbers under tight deadlines. Bettors and handicappers who rely on narratives without testing them risk mispricing outcomes and losing edge. The risk is practical: a framed story can change public perception and market prices even when the underlying evidence is weak.
How to Avoid Narrative Traps in College Football: how narratives form in coverage
The role of headlines, social media, and highlight moments
News cycles reward clear angles, and producers often choose a single, transportable image or quote to summarize a game. Those choices are efficient but not neutral; selecting a highlight moment can make a rare event look representative. Over time, repeated highlight-driven framing constructs a plausible but fragile narrative.
Cognitive shortcuts: recency, availability, and confirmation bias
Human judgment leans on recent and available examples because they are easier to recall, which explains why an upset or blowout quickly reshapes perceptions. Confirmation bias makes the problem worse: once an analyst favors a storyline, they are more likely to notice supporting evidence and downplay disconfirming data, so an explicit search for contrary evidence is necessary to avoid self-reinforcing errors Confirmation Bias definition.
One-sentence takeaway: treat a hot headline as a testable claim, not an established fact.

How to Avoid Narrative Traps in College Football: a practical checklist to test any story
Step 1: define the claim and time window
Start by translating the headline into a measurable claim. For example, change "Team X is back" to "Team X has improved yards per play by at least 0.5 compared to its first four games, measured over the last three games." A clear window prevents moving the goalposts after the data are seen.
Step 2: verify metric definitions
Before pulling any numbers, confirm how the metric is defined by the official source and by your data feed. Discrepancies in inclusion rules can flip conclusions, so write down the exact definition you are testing.
Translate the story into a measurable claim, confirm metric definitions, compare to opponent-adjusted baselines, and run a simple out-of-sample check before treating the story as true.
Step 3: compare to opponent-adjusted baselines
Place the claim into context by comparing performance to opponent-adjusted baselines or normalized ratings. A team that beats weak defenses will post raw gains that look impressive until you adjust for opponent strength. Opponent adjustment converts raw numbers into comparable signals across schedules.
Step 4: run a simple out-of-sample check
Run a holdout or rolling-window check to see whether the observed pattern persists outside the original sample. Small samples are noisy and often produce reversals; an out-of-sample check reduces the risk of overfitting and gives you a sense of stability Cross-Validation primer.
Verify metrics and align with NCAA definitions before you trust the headline numbers
Most-cited NCAA quirks that change stat totals
Some official recording rules change how totals are reported in ways that matter for narratives. A clear example is how overtime statistics relate to regulation totals; the official manual describes inclusion rules that can alter per-game averages if not handled consistently NCAA Statisticians' Manual. See related NCAA policies here and the NCAA 2022 Football Statisticians' Manual here.
An example mismatch: a third-party feed that appends overtime yards to regulation averages can make a late-game comeback look like a long-term trend. Always ask whether your data provider follows the NCAA manual or applies its own aggregation rules. For a plain-language overview of how overtime works in college football, see the NCAA explanation here.

How to match your data pulls to official definitions
Confirm the source, read the metric definition, and check inclusion rules such as whether overtime counts or how sacks are allocated. A short verification checklist is: source documentation, field-level definition, and a one-game spot-check against play logs. If your spot-check disagrees, escalate to the feed owner rather than assuming the feed is authoritative. See our homepage for tools and resources Funded Plays.
Adjust for opponents and strength of schedule: cornerstones of fair comparison
Why raw per-game numbers can mislead
Raw per-game or per-play numbers hide schedule context. Two teams with similar yardage per play can have very different quality wins if one faced tougher defenses. Without adjustment, schedules with more weak opponents will inflate a team’s apparent performance relative to a team with a tougher slate.
Simple opponent-adjustment approaches and rating frameworks
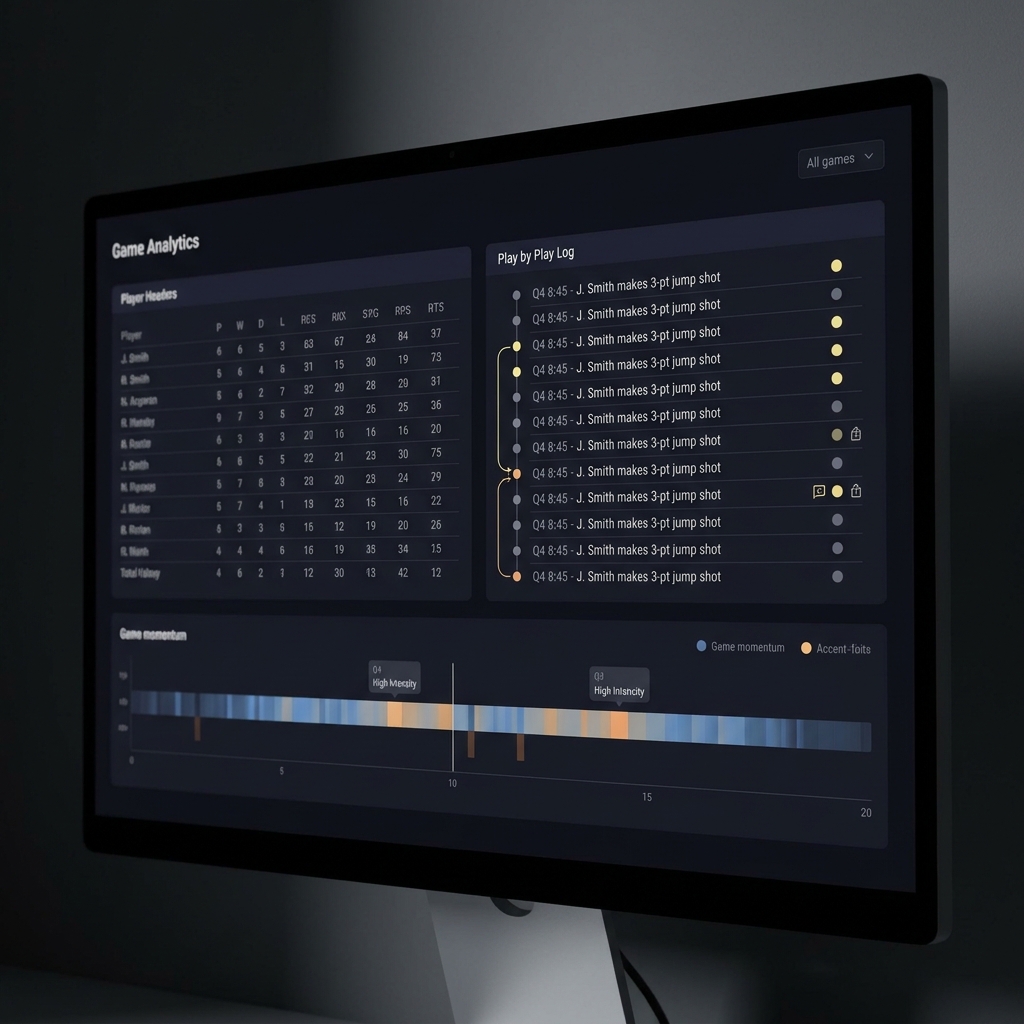
Classic rating frameworks normalize team outputs by opponent strength to create comparable ratings. These approaches date back to widely used methods for team rating and remain useful as practical baselines for stress-testing narratives Massey ratings theory.
Simple adjustments you can run in a spreadsheet include opponent-average normalization, where you subtract opponent-season-average yards allowed from a team's game result, and a basic points-exchange method that treats each game as evidence toward a relative rating. These lightweight methods provide quick sanity checks before you rely on more complex models.
Lightweight opponent adjustment worksheet for quick sanity checks
Use a three-game rolling window for stability
Use cross-validation and out-of-sample checks to avoid overfitting to small samples
Simple holdout and rolling-window checks
Cross-validation and holdout tests show whether a pattern is stable or a sample artifact. A simple approach is to hold the last game out and see if a model built on earlier games predicts that result reasonably well. Rolling-window checks repeat this over multiple cut points to assess consistency Cross-Validation primer.
Why early-season and small-sample claims are volatile
Early-season datasets have high variance because fewer games mean outcomes swing more due to randomness and matchup quirks. Treat early-season claims as provisional, label their confidence lower, and re-run checks as more data accumulates. That approach reduces the chance that a short run of results becomes a long-lived but incorrect narrative.
Practical tip: keep a replication sheet that logs the window, model, and holdout results so you can show how conclusions change as data grows.
Common mistakes and cognitive biases that keep narratives alive
Confirmation bias and cherry-picking
Confirmation bias leads analysts to favor evidence that supports their prior belief and to discount counterexamples. A practical countermeasure is a mandated disconfirming search where you actively look for data that would contradict the headline claim; making that search explicit reduces post-hoc rationalization Confirmation Bias definition.
Overreacting to small samples and garbage-time distortions
Small samples amplify noise and make rare plays seem more meaningful than they are. Garbage-time statistics or overtime-heavy games can distort per-game metrics if you do not consistently apply inclusion rules. Pre-specify windows and exclusions to avoid data shopping for the most flattering outcome.
One-sentence countermeasure: require a pre-specified test and at least one out-of-sample check before amplifying a new narrative.
Practical examples and scenarios: applying the checklist to real cases
Interpreting a one-off upset
Scenario: a three-point upset against a favored opponent becomes evidence that the underdog is legitimately better. First, define the measurable claim such as change in expected points over expectation for the last game versus the season. Then verify whether the upset was influenced by special teams or late errors that the headline omits; these details often change the interpretation.
Outcome: after checking the play-level definitions and opponent baseline, many upsets look like outliers until a consistent pattern appears across multiple out-of-sample checks Cross-Validation primer.
When a team 'heats up' after personnel change
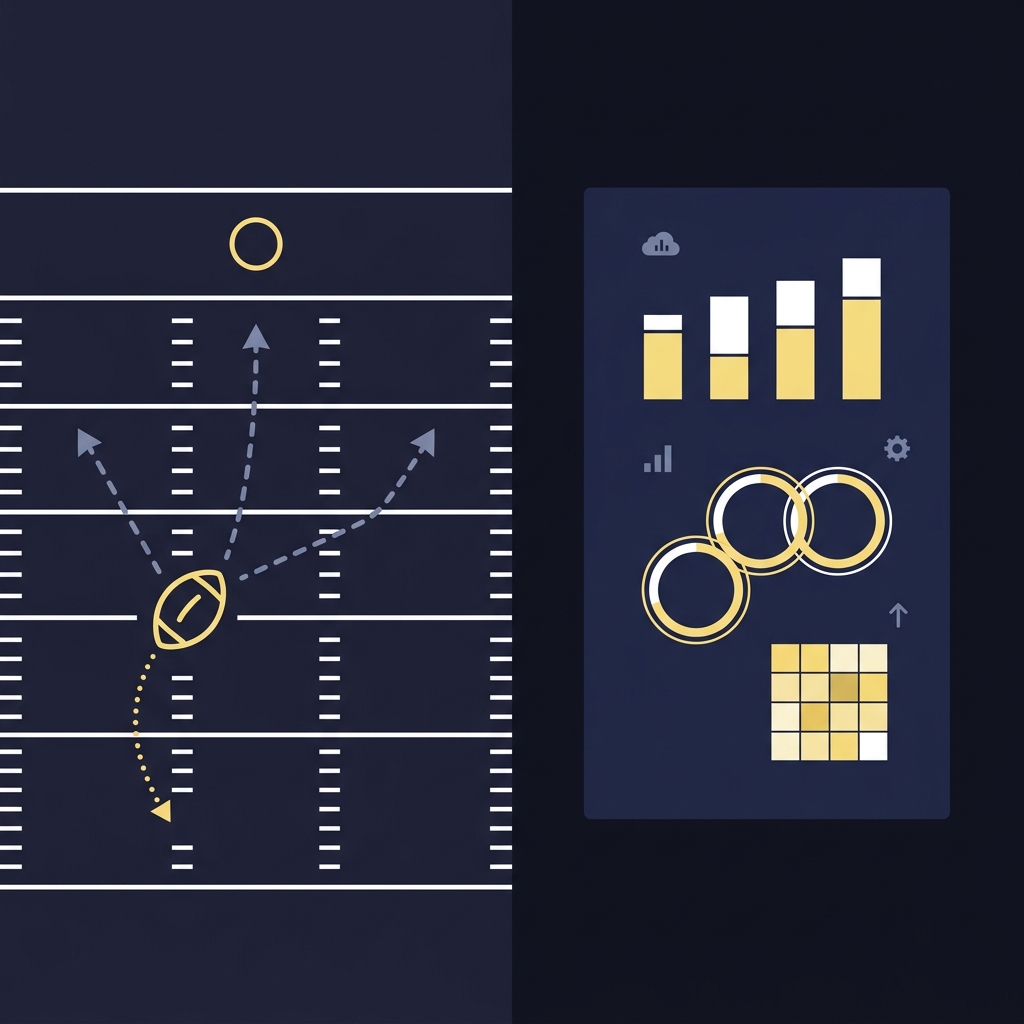
Scenario: a team improves after a quarterback change and headlines declare a permanent turnaround. Use opponent-adjusted baselines to see whether the new QB faced easier defenses, and run a rolling-window holdout to test whether the improvement predicts future outcomes. This catches both schedule quirks and small-sample volatility.
Verdict: apply opponent adjustment and a holdout check before treating the personnel change as a durable shift in team quality Massey ratings theory.
Schedule imbalance and inflated per-game stats
Scenario: a player posts big per-game numbers because the early schedule features weaker opponents. Compare the performance to opponent-adjusted baselines and note any NCAA definition quirks such as overtime handling that alter per-game denominators. This process often moderates the initial headline.
One-line verdict: most schedule-driven narratives need opponent adjustment to become reliable.
A concise playbook and closing takeaways
Quick checklist to follow in live coverage
Playbook: define the claim and window, verify definitions against the NCAA manual, normalize by opponent strength, and run at least one out-of-sample check before publishing. Label confidence and update as more data arrive. Following these steps systematically reduces false narratives and improves decision quality for analysts and bettors alike NCAA Statisticians' Manual.
How to communicate uncertainty and avoid misleading headlines
When sharing analysis, include the window, the adjustment method, and a short confidence label such as provisional, moderate, or robust. Transparency about method and uncertainty helps audiences interpret findings correctly and prevents premature amplification of weak signals. For an example of how Funded Plays evaluates changes over time, see this post here.
Label it provisional when the claim relies on fewer than four to six comparable games or when definitions or opponent adjustments have not been confirmed.
Yes, adjust for opponent strength whenever comparing raw per-game numbers across teams to avoid misleading conclusions from schedule differences.
Hold the most recent game out, test whether a model built on prior games predicts it, and repeat the process across a few cut points.
References
- https://oxfordre.com/communication/display/10.1093/acrefore/9780190228613.001.0001/acrefore-9780190228613-e-861
- https://www.fundedplays.com/blogs
- https://www.fundedplays.com/challenges
- https://dictionary.apa.org/confirmation-bias
- https://www.itl.nist.gov/div898/handbook/ppc/section1/ppc141.htm
- https://www.ncaapublications.com/p-4762-2024-ncaa-football-statisticians-manual.aspx
- http://fs.ncaa.org/Docs/stats/ForSIDs/Policies.pdf
- http://fs.ncaa.org/Docs/stats/Stats_Manuals/Football/2022.pdf
- https://www.ncaa.com/news/football/2025-01-01/how-college-football-overtime-works
- https://www.fundedplays.com
- http://masseyratings.com/theory/massey97.pdf
- https://www.fundedplays.com/blogs/how-fundedplays-evaluations-work