
How to Analyze Set-Piece Strength: overview and definitions
Start with a short, strict definition: set-pieces are the restart events listed in the Laws of the Game, and they should be the canonical categories you use when you tag and compare events for analysis. Using the same segmentation reduces errors when combining feeds or benchmarking teams across leagues, and it makes per-opportunity normalizations meaningful. In the 2024/25 Laws of the Game, set-pieces formally include corners, free kicks, penalties and throw-ins, which gives analysts the standard grouping to apply when they measure outcomes Laws of the Game 2024/25.
Clear definitions matter because different providers and scouting groups sometimes label similar events differently, which can create hidden denominators and misleading per-opportunity rates. By anchoring your workflow to the Laws of the Game categories you avoid mixing event types that should not be compared directly. This avoids the common mistake of combining defensive throw-ins with attacking corners in the same bucket and inflating or deflating per-opportunity metrics.
Anchor event categories to the Laws of the Game, document provider denominators, harmonize zones via coordinate mapping if needed, and validate by manual video checks on a labeled sample before using per-opportunity rates to compare teams.
Who benefits from a structured set-piece evaluation? Coaches who need focused practice plans, analysts preparing pre-match scouting, and scouts comparing opponents all gain actionable intelligence when set-piece strength is measured consistently. For teams with limited data resources, the same categories let video-based scouting and event feeds plug into the same workflow, which keeps recommendations aligned across staff. Funded Plays
Defining phases: delivery, first contact and second phase
Split every set play into three phases so tagging is repeatable and comparisons are meaningful. The recommended phase model is delivery, first contact and second phase. Delivery covers the ball entry method and target zone. First contact captures the initial aerial or ground contest at the drop zone. Second phase covers clearance outcomes, rebounds and follow-up sequences that lead to shots or turnovers.
Phase separation improves signal-to-noise because it isolates where an advantage was won or lost. If a team consistently wins the first aerial duel but concedes shots in the second phase, the problem is not the delivery. Conversely, high-quality second-phase organization can compensate for imperfect deliveries. Recent technical reports encourage separating the phases to reveal repeatable patterns UEFA EURO 2024 technical report.
Practical tagging examples help map the model to real data. Tag delivery with type (inswing, outswing, driven, floated), target zone (near, central drop, far), and whether it reached the intended channel. Tag first contact with result codes such as won aerial, lost aerial, clean head, poor touch, immediate shot. Tag second phase with clearance outcome, recovery location and whether the sequence produced a shot or shot-creating chance. These simple tags let event-only feeds approximate phase-level analysis even when full tracking is unavailable.

Set plays remain a material source of goals and shot value in elite tournaments, and technical summaries from recent competitions highlight evolving tactical elements that change how first contact and shot quality are achieved. Tournament and coaching reports show teams investing time in coordinated screens, near-post runs and hybrid defensive schemes, all of which alter the first contact environment for attackers and defenders UEFA EURO 2024 technical report. PSSA
How to Analyze Set-Piece Strength: why set plays still matter
At a mechanism level, corner and free-kick success is driven by delivery quality, targeted zones and winning the initial aerial duel. Systematic reviews find that targeted deliveries into high-probability zones and offensive numerical superiority around the drop zone improve scoring chances, which supports using first-contact and aerial-duel metrics as core KPIs Set‑pieces in football: a systematic review.
Get the one-page set-piece checklist on the FundedPlays Challenges page
Download the one-page checklist later in this article to apply the core KPIs during weekly reports.
For coaching implications, the practical takeaway is clear: routines and specialist coaching matter. Teams that drill delivery patterns, coordinate runs and rehearse second-phase recovery are more likely to convert set plays into shots. While there are no guarantees, the evidence supports dedicating training time to scripted set-piece work and opponent-specific preparation Corner kicks in soccer: determinants of success.
Core metrics to measure set-piece strength and how to compute them
Begin with normalization: report raw counts, per 90 minutes and per opportunity. Per-opportunity rates mean per corner or per attacking free kick and they control for tempo and possession differences between teams. Methodological guidance recommends combining per 90 and per opportunity so that both activity level and efficiency are visible in comparisons FIFA Training Centre: Set plays.
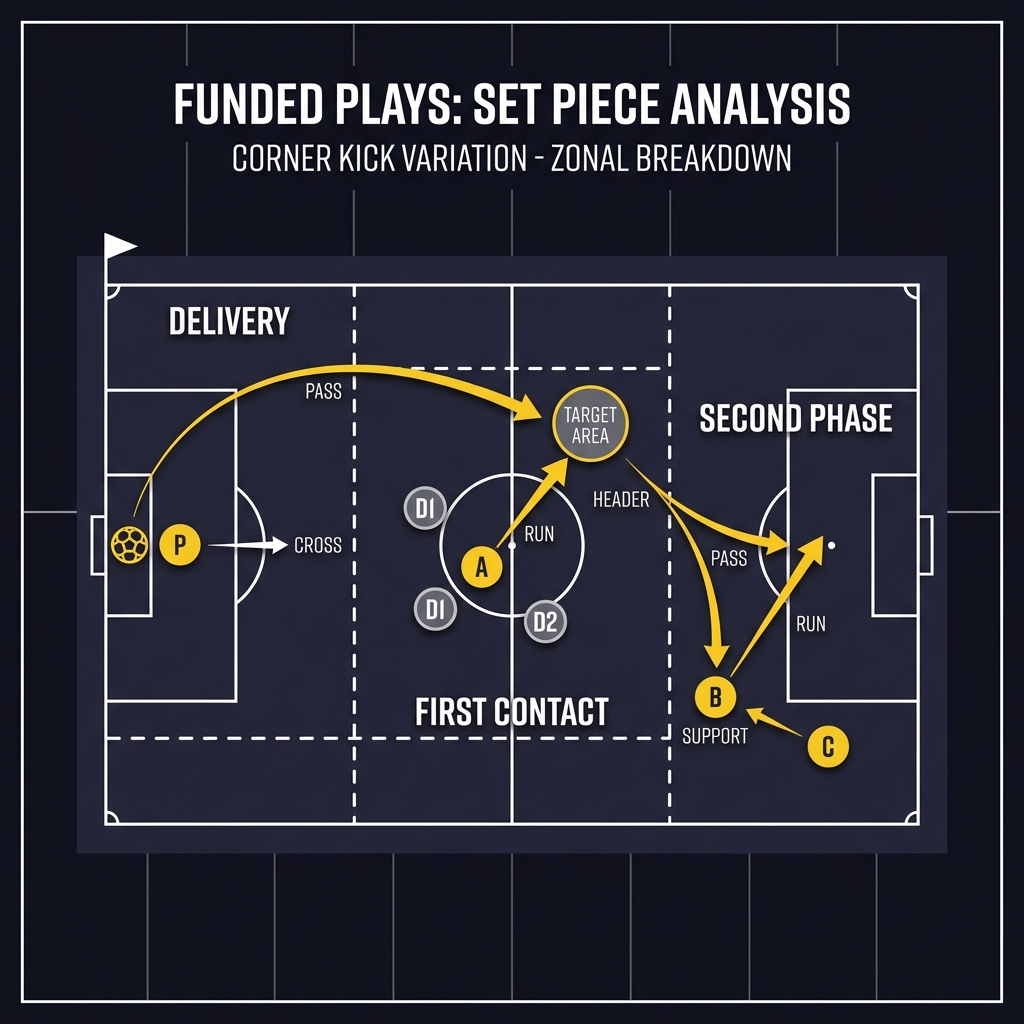
Primary KPIs to compute are first-contact rate, aerial-duel win rate and set-piece xG. Define first-contact rate as the share of deliveries that result in a successful first touch or contested contact in the intended drop zone. Compute aerial-duel win rate as the number of won aerial contests at first contact divided by the total first-contact aerial contests. Set-piece xG uses shot location and quality from set-piece sequences to estimate expected goals contributed by set plays; when shot-level xG is not available, use proximate proxies such as shot distance and body contact type.
Provide short formulas to make these calculations reproducible. First-contact rate = successful first contacts / total deliveries. Aerial-duel win rate = aerials won at first contact / aerials contested at first contact. Set-piece xG = sum of xG for shots arising from set pieces, normalized per 90 or per opportunity as needed. When you present these numbers, always show the denominator used, since per 90 and per opportunity paint different pictures.
Secondary KPIs include delivery accuracy, targeted zone success and second-phase retention. Delivery accuracy can be defined as deliveries reaching the intended target zone divided by attempts. Targeted zone success measures the share of deliveries into a specified drop zone that produce a shot or high xG sequence. Second-phase retention tracks the proportion of second-phase possessions that lead to a shot or maintain pressure within the opposing third. Each secondary KPI helps explain why a primary KPI looks strong or weak.
To compare teams quickly, combine metrics into a composite index that weights efficiency and volume. For example, a simple composite might combine per-opportunity set-piece xG, first-contact rate and aerial-duel win rate with weights tuned to your coaching priorities. Be cautious with aggregation because weighting choices can obscure trade-offs; always show component metrics alongside the index and avoid over-aggregation when sample sizes are small.
Data sources, tagging and practical limits
Event data and full tracking offer different strengths. Event-only feeds reliably support counts, delivery types and tagged first contact outcomes when tags exist, while tracking data enables precise zone definitions, player movement, screens and separation measures. Trackman. For most teams, high-quality event feeds plus targeted video validation cover the core KPIs; full tracking adds refinement but is not strictly necessary for actionable insights UEFA EURO 2024 technical report.
Collect a minimal tagging schema that supports the metrics described earlier. Recommended tags include delivery type, target zone, intended target, first contact result, aerial duel outcome, clearance type and defensive setup. Recording the provider denominator conventions for each tag is essential so you can compare rates across data sources without mixing apples and oranges.

When tags are missing, document the gaps and use conservative assumptions. For example, if the target zone tag is not present, map delivery coordinates to coarse zones and flag reduced confidence. For missing first-contact markers, supplement event feeds with manual video spot checks on a sample set to estimate bias and adjust denominators accordingly FIFA Training Centre: Set plays. (see how Funded Plays evaluations work)
Phase-based outcomes: measuring delivery, first contact and the second phase
Translate the phase model into measurable outputs so coaches can see where value is created. Delivery completion rate is deliveries reaching the intended zone divided by attempts. First-contact shot probability is the share of first-contact sequences that immediately lead to a shot. Second-phase retention is the share of sequences after the first contact that stay in the attacking third or produce a shot within the next n seconds.
Attribute goals or xG to phases carefully. If a direct shot follows the first contact, credit the first contact and delivery accordingly. If a clearance leads to a rebound and a shot from the second phase, attribute the second-phase retention and shot xG to the second phase. Tournament-level reviews recommend separating phases for outcome attribution because many set-piece chains involve distinct contributions across phases UEFA EURO 2024 technical report.
Examples clarify trade-offs. A weak delivery that is mis-targeted can still produce shots if the attacking team wins chaotic second-phase duels and retains possession. Conversely, a clean delivery to the drop zone that loses the first aerial duel yields no shot despite high delivery accuracy. Phase-level KPIs reveal whether problems stem from delivery, aerial contests or second-phase organization.
Defensive setups, counters and what to measure on the opponent
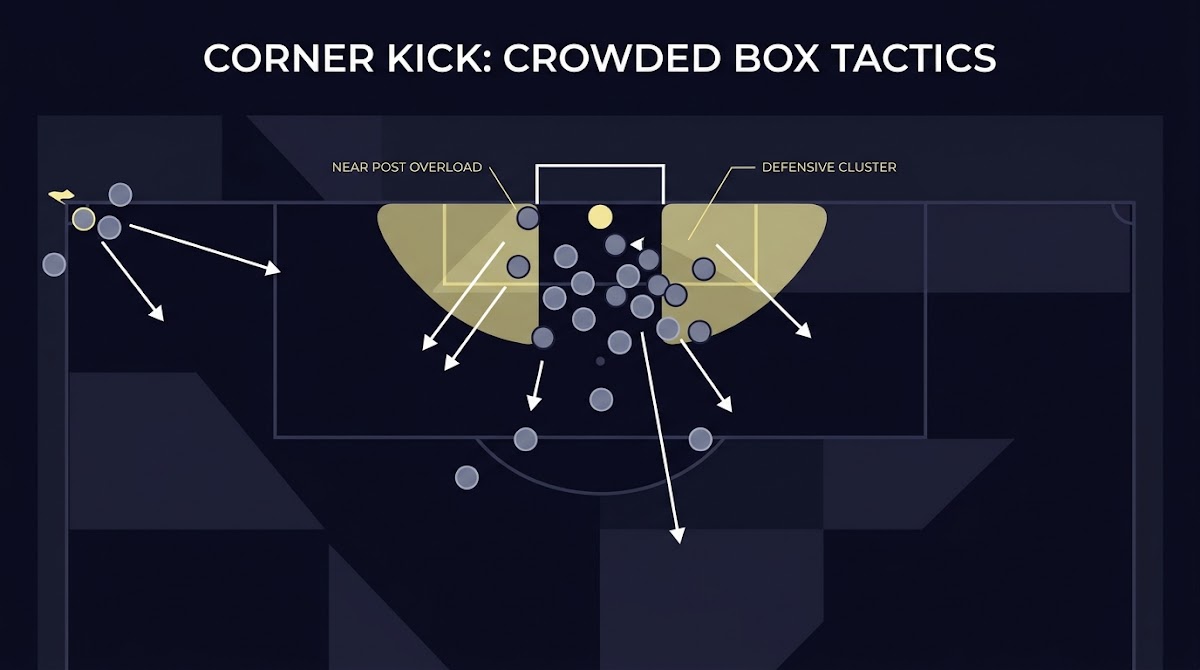
Defensive systems materially change set-piece value. The main defensive setups are zonal, man and hybrid marking, and each setup shifts where deliveries should be aimed and which runs are most effective. For example, zonal defenses often leave space in specific channels that you can target with well-timed runs, while man marking makes blocking and screens more effective at creating separation UEFA EURO 2024 technical report.
template to log opponent defensive traits and provider denominators
start with this template and adapt to your provider
Blockers, screens and near-post runs change first contact outcomes by creating separation or obstructing sightlines. Tag these tactical elements when visible and record which defenders are routinely used as blockers so coaches can plan countermeasures. Tournament analyses highlight coordinated screens and crowding as growing features of modern set play defense UEFA EURO 2024 technical report.
Use a short pre-match checklist of opponent tendencies to prepare routines. The checklist should include primary defensive setup, frequency of blockers/screens, propensity for near-post crowding, common clearance patterns and whether the opponent prioritizes weak-side retreats. This list helps coaching staff decide whether to exploit overloads, near-post flicks or second-phase positioning.
Visualizing set-piece patterns by zone and phase
Choose visuals that expose repeatable patterns quickly. Recommended visualizations include drop-zone success maps, first-contact outcome heatmaps and second-phase shot origin charts. Drop-zone maps show where deliveries land and the conversion rate from those zones. First-contact heatmaps reveal where aerial duels are won or lost. Second-phase charts show the origin of shots after the first contact and highlight recovery strengths and weaknesses Corner kicks in soccer: determinants of success.
Design a one-page set-piece report for coaches that places the highest-priority visuals at the top: a small composite score, a drop-zone success map, a first-contact heatmap and two annotated clips. Keep color choices simple: green for advantage or high conversion, amber for mixed results and red for clear weakness. Use numeric annotations for per-opportunity rates and denominators so coaches understand confidence at a glance.
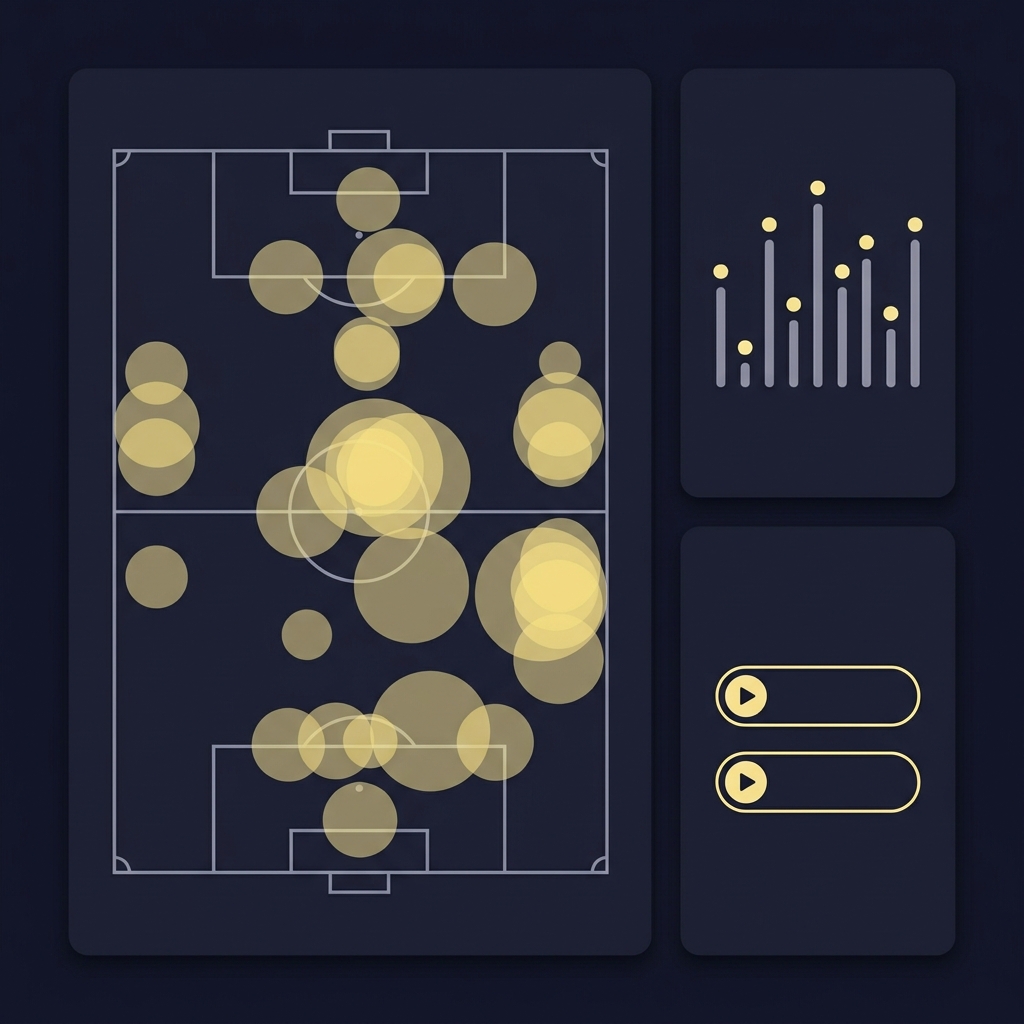
Layer phase information on zone maps by showing delivery targets and the predominant first-contact outcome from each target. For instance, annotate zones where deliveries frequently result in lost aerial duels so coaches can decide whether to change the delivery type or adjust attacking runs. Visuals that combine phase and zone provide a compact view of where to focus training time.
A decision framework: benchmarks, thresholds and when to change routines
Set realistic benchmarks normalized per 90 and per opportunity. Use historical league averages as starting points for per 90 and normalize per opportunity by dividing totals by the relevant event count such as corners or attacking free kicks. Benchmarking both ways shows whether a team needs to be more active or more efficient from set plays FIFA Training Centre: Set plays.
Define minimum sample sizes before acting. Small samples are noisy; recommend waiting for multiple matches or at least a predefined number of opportunities before overhauling routines. When sample size and effect size cross your pre-registered threshold, follow a staged response: monitor, test in training, deploy minor adjustments, then evaluate in-match. This staged decision tree balances responsiveness with the risk of overfitting.
Combine quantitative triggers with qualitative scouting. Data should highlight potential issues, and video scouting should confirm the tactical mechanism before coaches change instructions. This hybrid approach prevents making tactical changes based solely on noisy counts and helps ensure the proposed solution addresses the observed cause.
Common pitfalls, validation and provider comparability
Watch normalization mistakes and hidden denominators. Mixing per 90 rates with per-opportunity rates without clear labeling creates confusion. Similarly, provider-specific denominators for tags can change apparent rates; always document and harmonize denominators before comparing teams across feeds UEFA EURO 2024 technical report.
Avoid overfitting routines to small samples. Rehearse candidate changes in training and use holdout matches or sample splits to validate results before full deployment. Maintain a short validation checklist that includes sample splits, manual video spot checks and conservative confidence thresholds to reduce false positives in tactical adjustments.
The open problem of standardizing per-opportunity denominators across providers remains. When denominators differ, mitigate by using coarse zones, mapping coordinates to zones yourself, or running reconciliations on a labeled sample to estimate bias. Document any approximations and include provider confidence flags in reports. arXiv
Practical examples: corner routine analysis and free-kick scenarios
Corner routine example, step by step. Collect tags for delivery type, intended target and first-contact outcome on a sample of corners. Compute first-contact rate and aerial-duel win rate for the targeted drop zone. Visualize drop-zone success and annotate where defensive crowding or blockers appear. If the data show high delivery accuracy but low first-contact wins in the drop zone, recommend targeted blocking counters and adjusted run lines in training Set‑pieces in football: a systematic review.
Free-kick scenario. Classify deliveries as direct, floated into box, short ball to wide area or cutback. Compute chance-creation per opportunity by counting shots and high-xG sequences resulting from each delivery type, normalized per attempted free kick. If floated deliveries to a far-post channel consistently create higher chance rates, consider testing a variant of entries in practice and record the results across a pre-registered sample of matches Corner kicks in soccer: determinants of success.
Coach-ready summary template. One-paragraph summaries should state the key metric, the observed gap or strength, and a single clear recommendation. For example: 'Targeted deliveries to the central drop zone show 0.10 xG per 10 corners above league median; first-contact wins are 12 percentage points below expectation. Recommend practicing near-post blocking and two targeted delivery patterns for the next two training sessions.' Keep the summary short and link to two annotated clip timestamps.
Checklist and reproducible workflow for analysts
Daily tasks: log set-piece events from the last match, update per-opportunity counters and flag any unusual defensive setups observed on video. See the Funded Plays blog for examples.
Weekly tasks: produce the one-page set-piece report, run sample splits for validation and update benchmarks per 90 and per opportunity. Pre-match tasks: deliver the opponent checklist, annotated clips and a one-paragraph coaching brief highlighting two priorities.
Minimum tagging schema and outputs to produce. Fields to collect: event type, delivery type, target zone, first-contact result, aerial winner, clearance type, defensive setup and provider denominator. Outputs should include per-opportunity rates, first-contact and aerial-duel KPIs, a drop-zone map and two annotated video clips showing a representative positive and negative example.
Hand findings to coaches in a format they will use. Preferred delivery formats are a one-page PDF that leads with the visual summary, two short annotated clips with timestamps and a 60-second verbal briefing that pairs the top metric with the recommended training focus. This compact package increases the chance the coaching staff will act on the analysis.
Conclusion: where set-piece analysis adds the most value
Phase separation, a small set of core KPIs and careful normalization per 90 and per opportunity create a practical framework for improving set-piece performance. The evidence supports focusing on delivery quality, targeted zones and first-contact success as the main levers for conversion from set plays Set‑pieces in football: a systematic review.
Teams with limited data should prioritize reliable event tags and manual validation to approximate phase-level metrics, while teams with tracking can expand to measure screens and separation more precisely. Use the reproducible checklist in this article to turn observations into tested changes on the training ground and to avoid overfitting small samples. Set-piece analysis is a compact area where disciplined measurement and targeted practice can yield marginal gains when implemented with care FIFA Training Centre: Set plays.
Start by tagging events into the Laws of the Game categories, record delivery type and target zone, then compute per-opportunity rates such as first-contact rate and aerial-duel win rate.
Avoid overreacting to small samples; use a staged approach and wait for a predefined number of opportunities or multiple matches before implementing major changes.
Yes. High-quality event feeds plus systematic video spot checks and a minimal tagging schema support the core KPIs and coach-ready visuals.
References
- https://www.theifab.com/laws/latest/
- https://www.uefa.com/insideuefa/technical/technical-reports/uefa-euro-2024-technical-report/
- https://www.frontiersin.org/articles/10.3389/fspor.2024.00000/full
- https://sportsmedicine-open.springeropen.com/articles/10.1186/s40798-024-00650-1
- https://www.fifatrainingcentre.com/en/game/analysis/set-plays-insights-and-trends.php
- https://www.fundedplays.com/challenges
- https://www.trackman.com/blog/set-piece-performance-analysis-in-football
- https://thepssa.us/blog/set-piece-analysis-in-soccer
- https://www.fundedplays.com
- https://www.fundedplays.com/blogs
- https://www.fundedplays.com/blogs/how-fundedplays-evaluations-work
- https://arxiv.org/html/2505.15820v4