
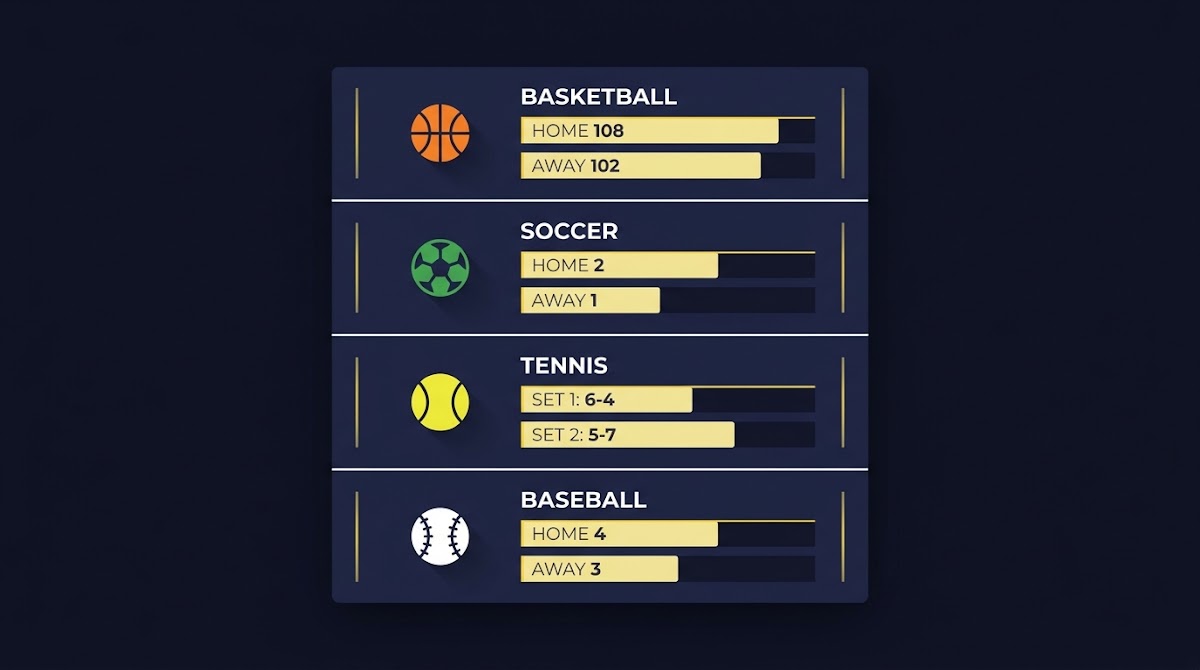
What cross-sport performance analysis is and when to use it
Definitions and scope
Cross-sport performance analysis compares metrics or outcomes from different sports to answer questions like platform-wide leaderboards, scouting across competitions, or studying transferable skill profiles. The goal is not to rank sports themselves but to create commensurate measures that let analysts evaluate participants or strategies fairly; starting with clear definitions avoids conflating tempo, opportunity, and rule differences that make raw comparisons misleading, a point central to standardization practices described in statistical handbooks NIST statistical handbook.
When cross-sport comparisons are meaningful, they typically share a common framing of opportunity and role. For example, comparing scoring efficiency for players requires aligning what counts as an opportunity in each sport, such as minutes, possessions, or plays. Without that alignment, simple aggregates will reflect tempo or rule differences rather than underlying performance.
When cross-sport comparison is meaningful
Use cross-sport comparison when you can define matching opportunity denominators and when the research question accepts some abstraction from sport-specific context. Common use cases include platform-wide leaderboards on skill-based challenges, multi-sport research projects, and product evaluations where a shared performance index is required. If the comparison would mix incompatible definitions or tracking systems without a way to normalize, pause and standardize first.
Quick starter checklist for cross-sport analysis
Keep field names consistent with the data dictionary
Practically, a short checklist helps teams decide whether a proposed comparison is valid: are identifiers consistent, is time or possession defined similarly, and can derived metrics be re-created from raw events? If the answers are no, defer the comparison until you have standardized inputs.
Start with schema-driven data: standards, dictionaries, and the Olympic Data Feed example
Why schemas matter for cleaning and joins
Schema-driven data models reduce ambiguity at the earliest stage of an analysis by specifying fields, types, and identifiers that make joins and validation routine instead of ad hoc; mature examples of this approach, such as the Olympic Data Feed, show how formal definitions can cut cleaning time and improve cross-event joinability Olympic Data Feed documentation.
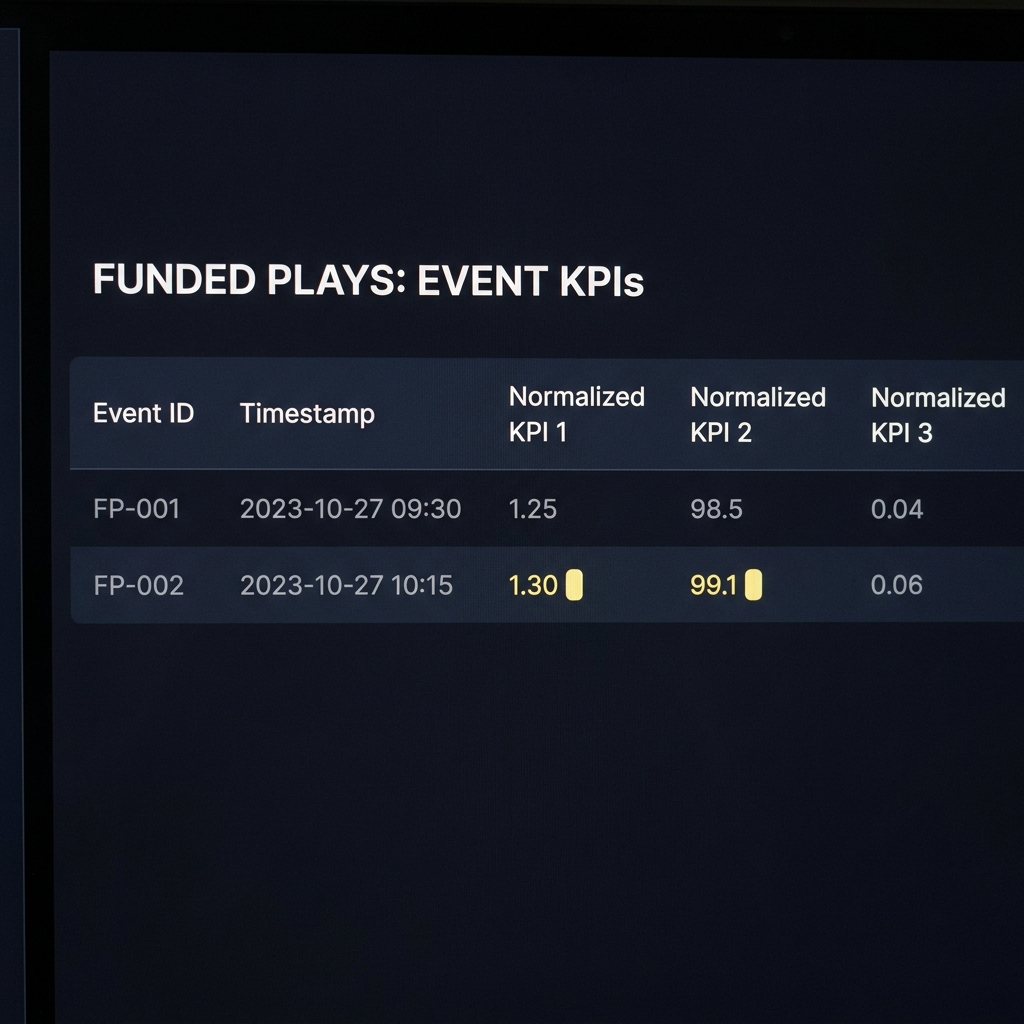
When two datasets use the same schema conventions, automated checks can run earlier in the pipeline and missing or malformed records stand out more quickly. The practical payoff is faster iteration and fewer silent mismatches when aggregating events from different competitions.
Key elements of a good data dictionary
A useful data dictionary lists required fields, allowed types, canonical event and participant identifiers, and clear timestamp semantics. It should also define derived fields and their calculation rules so downstream teams can reproduce each metric without guessing the original assumptions. A short evaluation checklist: does the dataset include unique IDs for participants and events, are timestamps time zone aware, are numeric fields typed explicitly, and are derived metrics documented?
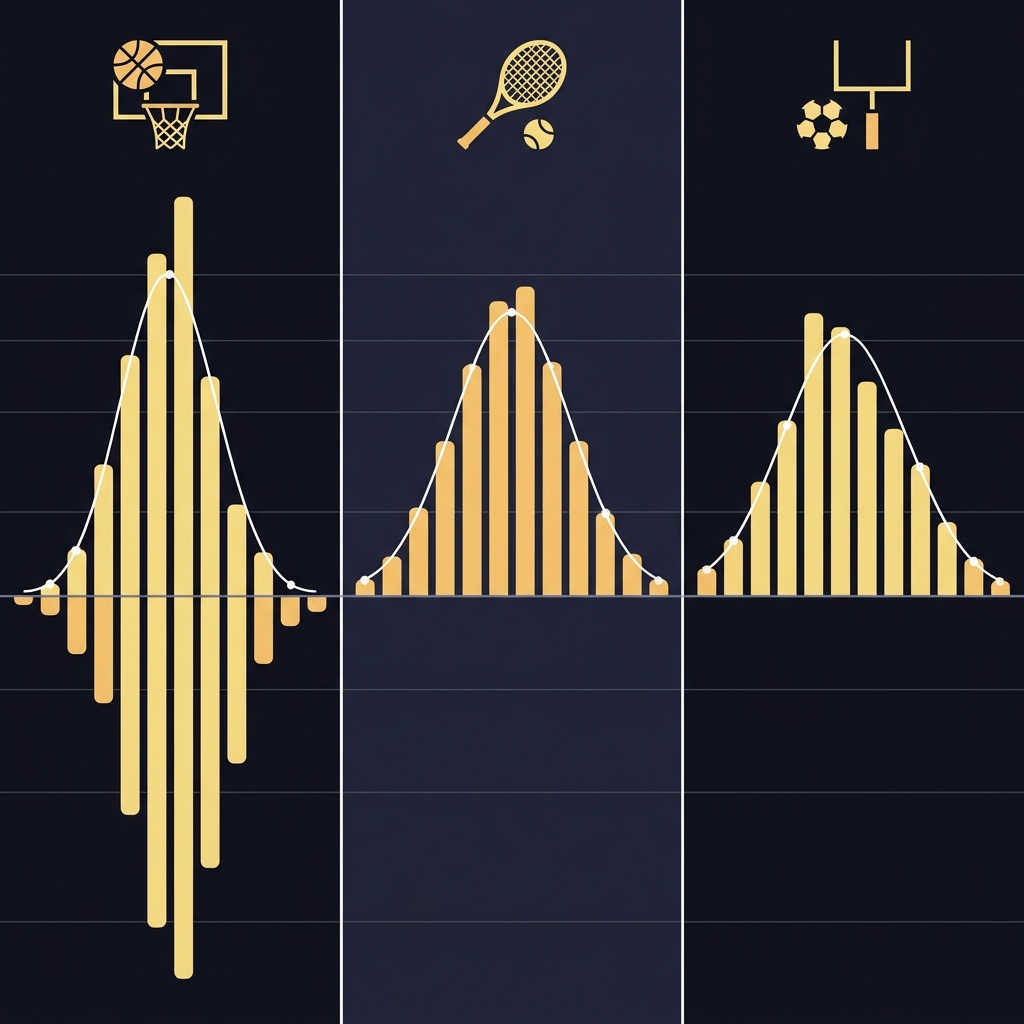
Assess datasets for schema stability and backward compatibility before using them in a multi-season or multi-sport index. Stable schemas reduce the need for rebasing and rework when sources update field names or types.

Designing KPIs: pairing universal indicators with sport-specific measures
Universal KPIs every analyst should track
Start KPI design with universal indicators that apply across sports, like win rate, margin per opportunity, volatility, and availability. Wherever possible use opportunity-normalized versions, for example margin per minute or per possession, so readers or systems do not confuse tempo with efficiency.
See how structured challenges clarify evaluation rules
Download or adapt a KPI checklist to ensure each metric has a clear definition, denominator, and calculation note.
Pair those universal metrics with sport-specific measures to capture domain nuance. For example, chance-quality or model-based metrics provide added insight where event detail permits.
Sport-specific KPI examples and conventions
Expected goals, or xG, is a model-based measure that estimates the probability a shot becomes a goal using historical shot features; it is a useful template for model-based KPIs but should be implemented using established conventions to avoid calculation drift What Are Expected Goals.
Basketball efficiency measures such as true shooting percentage and pace capture scoring efficiency and tempo; use league glossaries where available to ensure consistent definitions, for example the NBA stats glossary provides canonical definitions for TS% and pace NBA stats glossary.
Normalization and standardization: making metrics commensurable
Normalize by opportunity: per minute, per play, per possession
Normalize metrics by the appropriate opportunity denominator to remove tempo and exposure effects. Choices include per minute, per play, per possession, or per event depending on the sport and role; normalizing before aggregation is essential to avoid comparing high-frequency but low-quality opportunity profiles with low-frequency but high-quality ones NIST statistical handbook.
Decide whether denominators should be raw counts or adjusted counts that exclude specific contexts, such as garbage-time plays or dead-ball events. Document those exclusions so others can reproduce the normalization.
Standardization techniques: z-scores and min-max scaling
Once metrics are opportunity-normalized, standardize scales using z-scores or min-max scaling so KPIs with different units can be combined. Z-scores center on a mean and express results in standard-deviation units, which is useful when you want to preserve the distributional shape; min-max rescales to a fixed range when relative ordering within a bounded interval is more interpretable Handbook on constructing composite indicators.
Choose whether to standardize within leagues, within seasons, or across all sports. Standardizing within a league controls for league-specific scale and variance, while global standardization supports cross-sport ranking but can mask league idiosyncrasies; make this choice explicit and document the interpretive consequences.
Building composite performance indices: weighting, transparency, and robustness
Design choices when aggregating KPIs
When combining KPIs into an index, select a transparent weighting scheme. Common strategies include equal weighting, weights informed by expert judgment, or variance-based weights that downweight noisy metrics. Publish the weighting choice and rationale so users can assess the index construction.
Run sensitivity checks so stakeholders see how much ranks change if weights or normalization choices shift. This transparency helps avoid opaque results that may hide fragile conclusions.
Compare by aligning opportunity denominators, standardizing metric scales, using sport-specific KPIs alongside universal indicators, and publishing transparent index methods with robustness checks.
Document the index with a short method appendix that lists each KPI, how it was normalized, the weighting procedure, and any exclusions.
Sensitivity and robustness checks you must run
At minimum perform a weight sweep that varies weights across plausible ranges and records rank changes, and run alternative normalization schemes to confirm conclusions are not artifacts of a single preprocessing choice. These checks should be reproducible and stored alongside the final outputs Handbook on constructing composite indicators.
Publish sensitivity tables or visualizations that show rank stability to build trust with users and to reveal which components drive the index.
Reproducible pipelines and tidy data principles
Tabular tidy structures and labeled fields
Design pipelines around tidy, well-labeled tabular structures so each column is a variable and each row is an observation; this convention makes scripted transforms predictable and reduces accidental reshaping errors, a practice that remains foundational in reproducible analysis Tidy Data.
Keep raw ingests separate from cleaned intermediates and derived datasets. Store intermediate artifacts with version tags so you can trace back a published index to the exact input snapshot and transformation script that produced it.
Version control, scripted transforms, and outputs
Use scripted ETL processes and version control for both code and data artifacts where possible. Track schema changes in a changelog and tag releases of your index to match code and data versions. These practices make it possible to re-run experiments and to audit results if questions arise.
Prepare small, documented intermediate datasets for reviewers: a reproducible notebook, a method appendix, and a concise data dictionary allow peers to re-create the most critical steps without providing full raw feeds.
Sport-specific examples: football expected goals and basketball efficiency metrics
How xG is defined and what to watch for
Expected goals (xG) models estimate the probability that a shot becomes a goal given shot event features such as location, assist type, and match context; xG provides a model-based chance-quality measure that can be normalized and compared when you follow consistent conventions for feature selection and model training What Are Expected Goals.

When incorporating xG into cross-sport work, document the model input fields and whether the xG series is produced by you or by a vendor. Different implementations can yield materially different scales, so normalization and careful documentation are essential.
Basketball metrics: pace, TS%, and effective field goal percentage
Basketball metrics such as pace, true shooting percentage (TS%), and effective field goal percentage (eFG%) measure tempo and scoring efficiency; rely on league glossaries to compute them consistently, and treat pace as an exposure measure to be used as a denominator when appropriate NBA stats glossary.
Combine these efficiency metrics with universal indicators like margin per possession to create hybrid views that capture both domain nuance and cross-sport comparability.
Decision criteria for choosing data sources and vendor models
Assessing vendor definitions and measurement methods
Use a short rubric when evaluating a provider: documentation completeness, schema stability, update cadence, and transparency of derived metrics. Prefer sources where derived metrics are reproducible from raw event fields or where the vendor provides clear computation notes.
Recognize that different tracking technologies or model assumptions create incompatibilities. When possible, obtain raw events and re-derive vendor metrics using clear definitions rather than importing opaque aggregates.
Data quality indicators to prioritize
Prioritize datasets with consistent identifiers, low missingness on key fields, clear timestamp semantics, and stable field types. If a vendor changes a derived metric definition mid-season, treat that as a schema break and rebased historical values before combining seasons or competitions.
Document acceptance thresholds for missingness and field drift so source selection remains consistent and defensible over time.
Comparing across competitions and seasons: alignment strategies
Handling rule changes and competition structure differences
When rules or competition formats change, re-base historical series or apply a harmonization step that maps old structures to new ones. For example, if a competition changes substitution rules or match length, create a transformed series that aligns the effective opportunity denominators before combining seasons Olympic Data Feed documentation.
In long-term studies, note the rule-change dates in a method appendix so readers know exactly how periods were aligned.
Seasonal and sample-size adjustments
Apply minimum sample thresholds and consider shrinkage or hierarchical modeling when sample sizes are small. Small-sample instability can distort cross-sport rankings, so favor conservative adjustments or explicit uncertainty estimates before publishing a comparative index NIST statistical handbook.
When possible, run season-level sensitivity tests to see whether a single outlier season drives a player's or team's cross-sport placement.
Common errors and pitfalls to avoid
Misapplied normalizations and hidden biases
Common mistakes include mixing raw and opportunity-normalized metrics, failing to document exclusions, and using vendor aggregates without confirming definitions. These errors create hidden biases that surface only after publication, so run pre-publication checks on denominators and distributions.
Check for distributional mismatches and outliers before combining metrics; a heavy-tailed KPI may require transformation before standardization to avoid undue influence on composite indices Handbook on constructing composite indicators.
Overfitting and opaque composite indices
Avoid complex weighting schemes that are not reproduced in the method appendix. Opaque indices can appear to confirm prior beliefs while actually reflecting overfitting to a specific sample. Publish sensitivity results and, if possible, hold out an evaluation period to confirm the index behaves as expected.
Include a short pre-publication QA checklist: distribution checks, outlier review, replication of core calculations, and a peer review of index logic.
Sensitivity and robustness checks you should run
Weight sweeps and alternative normalization runs
Run a weight sweep that varies weights across plausible ranges and records rank changes; flag components that move a subject across significant rank bands. Complement this with alternative normalization strategies to ensure single preprocessing choices are not the sole cause of observed differences Handbook on constructing composite indicators.
Document the sweep results and summarize which metrics are most influential on final ranks.
Bootstrapping and uncertainty quantification
Use resampling such as bootstrapping to estimate rank stability and to produce confidence intervals for index scores. Present uncertainty alongside point estimates so consumers understand where results are robust and where they are tentative.
Store resampled outputs and present a short summary table of rank probabilities for key subjects when publishing a leaderboard or index.
Practical analyst scenarios and mini workflows
Building a cross-sport leaderboard from scratch
Workflow: ingest raw events, validate with a schema checklist, normalize metrics by opportunity, standardize scales, construct a composite index with documented weights, run sensitivity checks, and publish artifacts with a notebook and method appendix. Deliverables should include the reproducible notebook, a concise data dictionary, and sensitivity visualizations so readers can replicate findings.
A minimal reproducible approach focuses on clarity over complexity: choose a small set of well-documented KPIs, be explicit about denominators, and release the transformation scripts used to create each intermediate artifact.
Evaluating a single-player across two sports
When assessing performance transferability for an athlete or participant moving between sports, start by mapping role equivalents and matching opportunity definitions. Use model-based metrics for chance quality where available and normalize them to the same z-score framework before comparison.
Flag interpretation caveats in the method appendix: differences in physical demands, competition depth, and sample sizes can all affect transferability judgments and should temper conclusions.
Implementation checklist and recommended reading
Quick implementation checklist
Actionable steps: validate schemas, confirm identifiers, select universal and sport-specific KPIs, normalize by opportunity, standardize scales, choose transparent weights, run sensitivity checks, and publish reproducible artifacts with a method appendix. Each step should be recorded in a changelog so reviewers can see exactly what changed between versions.
Keep the checklist short and executable by a small team so iterations remain fast and auditable.
References and docs to consult
Key references to consult include authoritative schema documentation for event feeds, league or vendor glossaries for sport-specific metrics, statistical handbooks for normalization, composite indicator methodology guides, and tidy data principles to structure your pipelines; these sources form the backbone of robust cross-sport work IPTC Sport Schema and model comparison pages.
When in doubt about a vendor metric, prefer re-derivation from raw event fields or ask the vendor for computation details before including a metric in a composite index.
Conclusion and next steps for analysts
Key takeaways
Fair cross-sport comparison rests on careful schema validation, opportunity normalization, a mix of universal and sport-specific KPIs, transparent index construction, and reproducible pipelines. Document choices and publish sensitivity checks so others can evaluate how robust your conclusions are Handbook on constructing composite indicators.
Open questions and future directions
Open challenges include harmonizing vendor-specific model outputs across providers and quantifying model uncertainty when tracking technologies differ. Pilot an index, solicit peer feedback, and iterate on weighting and normalization choices as part of continuous improvement.
Cross-sport performance analysis compares metrics from different sports after aligning opportunity denominators and standardizing scales so results are commensurate and interpretable.
Normalize metrics whenever tempo or exposure differs between subjects, for example by minutes, plays, or possessions, to prevent scale differences from driving results.
Publish the KPI list, normalization steps, weighting rules, and sensitivity checks so others can reproduce and critique the index construction.
References
- https://www.itl.nist.gov/div898/handbook/
- https://odf.olympictech.org/
- https://www.fundedplays.com
- https://www.fundedplays.com/blogs
- https://www.fundedplays.com/blogs/how-fundedplays-evaluations-work
- https://theanalyst.com/na/2024/08/what-are-expected-goals-xg/
- https://www.nba.com/stats/help/glossary
- https://publications.jrc.ec.europa.eu/repository/handle/JRC47008
- https://doi.org/10.18637/jss.v059.i10
- https://www.fundedplays.com/challenges
- https://www.iptc.org/standards/sport-schema/
- https://sportschema.org/other-models/