
What goaltender matchup analysis is and why it matters
How to Analyze Goaltender Matchups
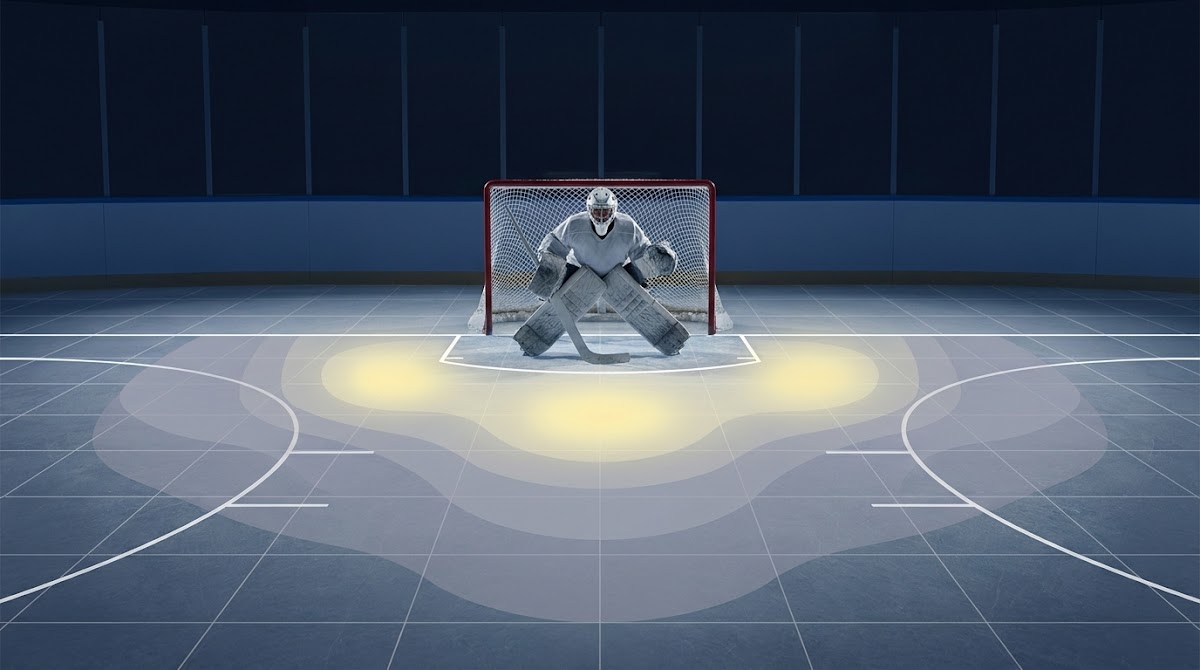
Goaltender matchup analysis aims to separate a goalie’s intrinsic shot-stopping skill from the context that surrounds every game. Instead of relying only on save percentage, this approach combines quality-adjusted metrics with situational context so nightly start or bench choices reflect the true chance environment a goalie faces. For the evaluation of quality-adjusted performance, methods like goals saved above expected and expected goals against are central because they account for shot quality, not just outcomes; see the MoneyPuck methodology for background on these measures MoneyPuck methodology.
At its core, matchup analysis answers a simple question: is the goalie outperforming what the shots he faces would predict, or are the team and opponent contexts explaining his results? Tracking-powered fields and public xG frameworks make this comparison reproducible by adding spatial and pre-shot detail to shot counts. The NHL EDGE portal makes standardized tracking outputs available that help separate slot and rush looks from lower-danger perimeter shots NHL EDGE.
nightly worksheet to record core matchup inputs
Copy into a spreadsheet for consistent logging
The practical payoff is straightforward. A repeatable matchup process reduces noise, helps avoid overreacting to short hot streaks, and creates the discipline needed for long-term performance evaluation in prediction challenges and fantasy lineups. When you make decisions consistently and log outcomes, you can calibrate weightings and improve edge estimation without inventing facts.
Key data sources and metrics to use
Reliable public inputs are essential for reproducible matchup scoring. Three widely used sources are the NHL EDGE tracking portal for spatial and pre-shot movement proxies, MoneyPuck for expected goals and GSAx methodology, and Natural Stat Trick for clear definitions of xGA, high-danger chances, and other glossary items. Each project contributes a complementary piece to the analytical stack NHL EDGE.
GSAx is useful as a measure of over- or under-performance relative to expected goals against, while xGA captures the quality-adjusted workload a goalie has faced over a window. MoneyPuck explains how expected goals frameworks adjust for location and shot context, which is why GSAx and xGA are preferred over raw save percentage when shot difficulty varies MoneyPuck methodology. For a quick reference to current goalie stats see the MoneyPuck goalie table MoneyPuck goalie stats.
High-danger chances and slot share are practical ways to quantify where and how opponents generate value. Natural Stat Trick’s glossary is a concise reference for interpreting xGA and HD chance definitions and helps translate the raw numbers into actionable signals when you review nightly lines Natural Stat Trick glossary.

Read in context, these metrics tell a coherent story: xGA provides an expectation for workload, GSAx shows how a goalie has performed relative to that expectation, and slot or rush measures indicate whether tonight’s opponent typically creates the kinds of chances that increase expected goals. Bringing these sources together gives a defensible, reproducible starting point for decisions.
How to combine GSAx, xGA and shot-location into a matchup score
Prioritize quality over raw volume when building a composite matchup score. GSAx and xGA are central because they account for shot difficulty and expected outcomes, which helps avoid misleading conclusions that arise from save percentage alone. The methodology updates and discussions in public models demonstrate this rationale and explain why the quality-adjusted measures should be weighted higher Evolving-Hockey goaltender model update.
Conceptually, a simple reproducible formula might combine three components: recent GSAx trend to capture short-term form, xGA per game or per 60 to reflect workload, and a shot-location factor that scales with opponent slot share or high-danger rate. Weighting is a matter of preference, but a defensible approach is to give the quality components more influence than sheer shot counts and to keep the scheme transparent so you can log and adjust it.
Combine recent GSAx form, xGA workload, opponent slot and movement scores, and a qualitative rest/workload modifier into a single composite score, then map that score to start, consider, or sit while logging outcomes for calibration.
For interpretability, express the composite score on a simple scale such as Negative, Neutral, Positive, where Negative suggests sitting the goalie, Positive suggests starting, and Neutral indicates marginal action or further research. Use consistent windows for GSAx and xGA (for example, the last 7 to 21 games) and keep the formula fixed while you collect outcomes for calibration. Model updates in 2024 to 2025 show that combining shot location and rebound or traffic proxies produces more stable nightly signals than raw rates alone Evolving-Hockey goaltender model update.
Incorporating opponent shot profile: slot, rush, and movement
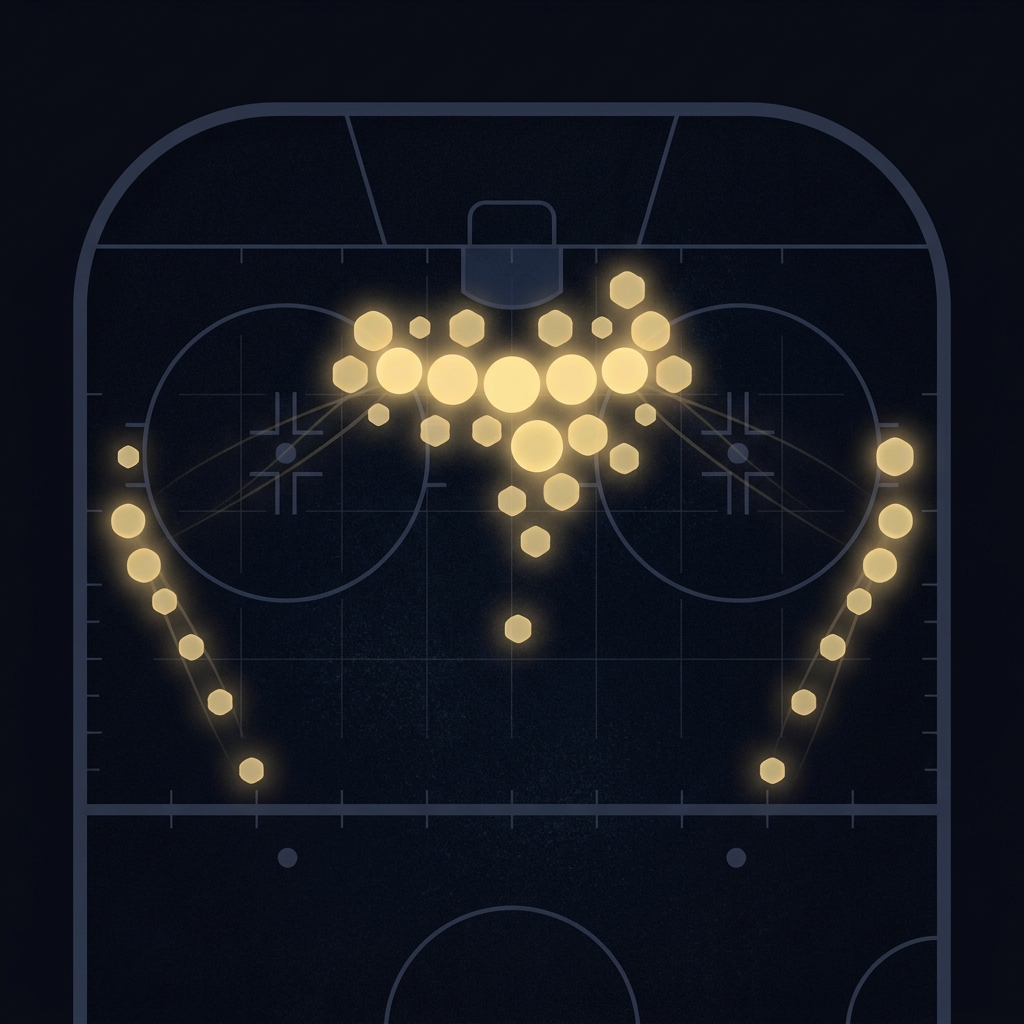
Opponent shot quality, especially slot share and east-west or pre-shot movement chances, is a primary driver of expected goals, so it should receive precedence over simple shot volume. Peer-reviewed work on spatial shot models outlines why location and movement matter for xG and for how goalies are tested by different chance types PLOS ONE paper on expected goals.
When you read opponent shot maps and possession fingerprints, look for concentration of shots around the slot, a high share of rush chances, and frequent lateral movement before release. The NHL EDGE tracking fields make these patterns visible and support reproducible scoring of opponent threat level. Use those fields to distinguish teams that create perimeter volume from those that consistently generate high-danger looks NHL EDGE.
Practical tips: mark an opponent’s slot share as high, medium, or low relative to league context and give extra weight to east-west pre-shot movement because it tends to increase goaltending difficulty. Seeing that pattern repeatedly in the opponent’s recent games should raise your matchup risk estimate and pull the composite score toward caution.
Scoring schedule and workload effects: rest, back-to-backs, and travel
Schedule context matters. Research into back-to-back games and congested schedules finds measurable performance declines associated with fatigue and travel, so incorporate rest explicitly into nightly scoring rather than treating it as noise Journal of Sports Analytics study on schedule effects.
Workload is the interaction between recent shot volume, high-danger against, and rest. A goalie who has faced a heavy xGA load over several days and then plays on short rest carries more performance risk than an otherwise similar goalie with time to recover. While the exact magnitudes are uncertain, including a qualitative rest rubric helps reduce overlooked risk.
Explore structured prediction challenges with FundedPlays
Try this checklist on one upcoming game, score the goalie and opponent using the rubric here, and log the outcome while following platform rules and responsible participation guidance.
Suggested qualitative scoring rubric: Rested means two or more days without a full workload, Moderate means one day or light recent workload, and Heavy means multiple recent games with high xGA or a back-to-back situation. Treat the rubric as a modifier that nudges the composite score, not as a standalone override.
Because workload effects interact with opponent creation rates, score both elements and combine them. For example, a rested goalie facing a team that generates few slot looks should present a clearer start call than a fatigued goalie facing a rush-heavy opponent.
Building a reproducible checklist for nightly decisions
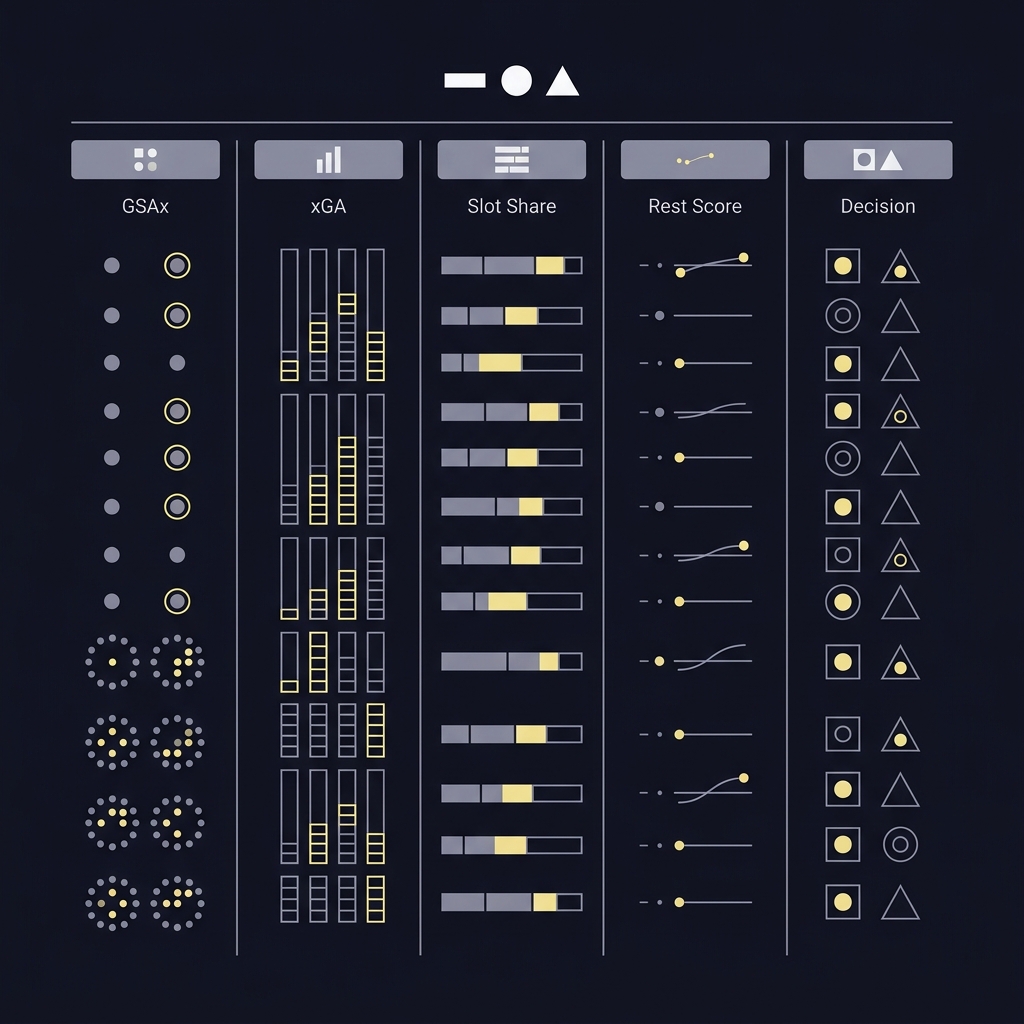
A nightly checklist keeps decisions consistent. At minimum, score recent GSAx form, xGA workload, opponent slot share, pre-shot movement risk, rest/workload status, and expected shot volume. Those fields cover the metrics and contexts that the public model updates and tracking-derived practices highlight as most relevant Evolving-Hockey goaltender model update.
When a tracking field is missing, use league-average proxies. For slot or traffic measures, a league-average slot share or a simple high-danger shot percentage can stand in until EDGE fields are accessible. Public models often rely on such proxies when full tracking inputs are unavailable, and the practice keeps your checklist usable across data sources Evolving-Hockey goaltender model update.
Make the checklist reproducible: record the date and source of each input, apply fixed weightings for the composite score, and save the decision and outcome. Over time you will have the data needed to adjust weights based on empirical performance rather than gut feel.
A step-by-step decision framework: when to start, sit, or target matchup edges
Translate the composite matchup score into clear actions. A defensible mapping is: Positive equals start, Neutral equals consider or reduce exposure, and Negative equals sit. That mapping is a guideline rather than a guarantee, and it aligns with public evaluation practices that use composite scores to inform start decisions MoneyPuck methodology.

Use a margin concept to express confidence. Large positive margins suggest a clear start, small positive margins suggest limited exposure or conditional starts, and similar negative margins suggest caution. Communicate uncertainty by noting whether a recommendation relies on thin samples or on solid multiweek signals.
When applying edges in prediction contests or platform challenges, follow platform rules and the principle of responsible participation. Platform challenges and community rules vary, so align your process with site guidelines and responsible participation principles.
Common mistakes and pitfalls to avoid
Relying only on save percentage is a frequent error. Save percentage hides shot quality and can reward goalies on teams that suppress slot looks; using quality-adjusted metrics like GSAx and xGA helps avoid this trap and provides a fairer view of performance MoneyPuck methodology.
Overreacting to short hot streaks or tiny samples creates noise and often leads to worse decisions. Public model updates caution against overweighting short windows without sufficient sample, and the recommended remedy is consistent logging and empirical recalibration Evolving-Hockey goaltender model update.
Ignoring schedule and workload can flip expected outcomes. A goalie who appears strong on raw numbers can be at higher risk after repeated heavy workloads or on back-to-back nights; including rest and workload as explicit checklist items mitigates that hidden risk Journal of Sports Analytics study on schedule effects.
Practical scenarios: three real-style matchup walk-throughs
Scenario A, rested goalie vs heavy high-danger team. Look at the goalie’s recent GSAx trend and xGA workload, then score the opponent’s slot share and east-west movement tendency. If the goalie’s GSAx shows consistent positive performance but the opponent’s slot share is markedly high, the composite score may be Neutral or Negative even when raw save percentage looks strong. Use the EDGE or public shot maps to inform the slot assessment NHL EDGE.
Scenario B, hot goalie on a back-to-back. A short-term hot run in GSAx can be tempting to trust, but schedule effects and workload interaction matter. If the goalie played heavily the previous night and faces a high-xGA opponent, downgrade the confidence even if the recent form looks appealing on surface stats. Research on back-to-backs supports this cautious adjustment Journal of Sports Analytics study on schedule effects.
Scenario C, strong team defense masking a weaker goalie. A goalie on a team that suppresses slot chances may show good save percentage despite limited underlying skill. Cross-check GSAx and xGA and inspect opponent chance location. If GSAx is low while save percentage is high, suspect the team defense is the main driver of results and prefer the opposing goalie in matchups where the opponent creates more slot chances MoneyPuck methodology.
Translating tracking-derived features into public xG and proxies
NHL EDGE fields map to common public xG components by describing where shots originate and whether pre-shot movement or traffic was present. Analysts use those fields to adjust spatial xG and to refine how much weight to give different chance types in a composite score NHL EDGE.
When EDGE fields are unavailable, proxies such as high-danger shot percentage, rebound rates, or a team’s documented rush chance rate can be used. Public model practices often substitute league-average slot shares and then adjust with observable signals until tracking inputs are accessible, which keeps decision frameworks usable across data availability levels Evolving-Hockey goaltender model update.
Keep in mind that translating tracking-derived features into a public xG proxy introduces uncertainty. Log your proxy choices and outcomes so you can recalibrate how aggressively those proxies influence the composite score.
Small-sample issues, hot streaks, and how much to trust recent form
Distinguish statistical noise from persistent signal by treating short-term spikes in GSAx as suggestive rather than definitive. Model authors recommend caution when samples are small, and it is prudent to avoid sweeping weight changes based on thin data windows Evolving-Hockey goaltender model update.
Practical rules of thumb include requiring an observable pattern across multiple games before increasing weight to recent form. Use your logging data to move from rules of thumb to calibrated weights as your sample grows.
Keeping your process reproducible and tracking results
Minimum fields to log each night are date, opponent, goalie, GSAx and xGA values used, slot or rush scores, rest/workload score, decision, and outcome. Recording these fields consistently creates the dataset needed to test and adjust your weightings over time MoneyPuck methodology.
For recalibration, compare predicted edges to actual outcomes and look for systematic bias. If your process consistently overstates starts that lose, reduce the weight on the biased inputs and rerun the test over a holdout period. Make incremental adjustments and avoid frequent ad hoc changes.
Advanced considerations: rebounds, traffic, and goalie styles
Rebound dynamics and traffic change shot quality because they create more scoring opportunities from the same original shot location. Modern model updates try to capture these modifiers because they materially influence expected goals and the reliability of goalie evaluations Evolving-Hockey goaltender model update.
Goalie styles matter as well. Some goalies excel in positioning and reduce quality chances, while others rely on reflex saves and may show different patterns in GSAx under heavy rebound or traffic stress. Track stylistic signals separately if you can, and be conservative about adding complex modifiers unless your sample supports them.
Conclusion and quick reference checklist
Quality-adjusted metrics like GSAx and xGA plus shot-profile features and schedule adjustments form the core of defensible matchup analysis. Using those inputs in a reproducible checklist lets you make evidence-based start, sit, or target decisions while logging outcomes for calibration MoneyPuck methodology.
Copyable nightly checklist: GSAx trend, xGA workload, opponent slot share, pre-shot movement risk, rest/workload score, final composite action. Treat the checklist as a disciplined process rather than a guarantee, and use logged results to refine weights over time. For more on running repeatable evaluations see our blog.
GSAx measures goals saved above expected by comparing a goalie’s results to the expected goals they faced, helping separate individual performance from shot quality.
Treat back-to-back appearances as increased risk and downgrade confidence in short-rest situations, especially when the opponent generates many high-danger chances.
Yes, use public xG and sensible proxies like high-danger percentage or league-average slot share, but log outcomes and recalibrate as you gather data.
References
- https://moneypuck.com/about.htm
- https://www.nhl.com/edge
- https://www.espn.com/fantasy/hockey/story/_/id/46929492/espn-fantasy-hockey-lineup-player-trends-goalies-power-play-add-drop-lines-matchups
- https://moneypuck.com/goalies.htm
- https://www.naturalstattrick.com/glossary.php
- https://evolving-hockey.com/blog/2024-25-goaltender-model-update/
- https://journals.plos.org/plosone/article?id=10.1371/journal.pone.0274921
- https://content.iospress.com/articles/journal-of-sports-analytics/jsa230
- https://www.fundedplays.com/challenges
- https://www.fundedplays.com
- https://www.fundedplays.com/blogs
- https://www.fundedplays.com/blogs/how-fundedplays-evaluations-work
- https://www.nhl.com/news/topic/nhl-edge/nhl-edge-site-new-look-has-advanced-statistics-for-everybody