
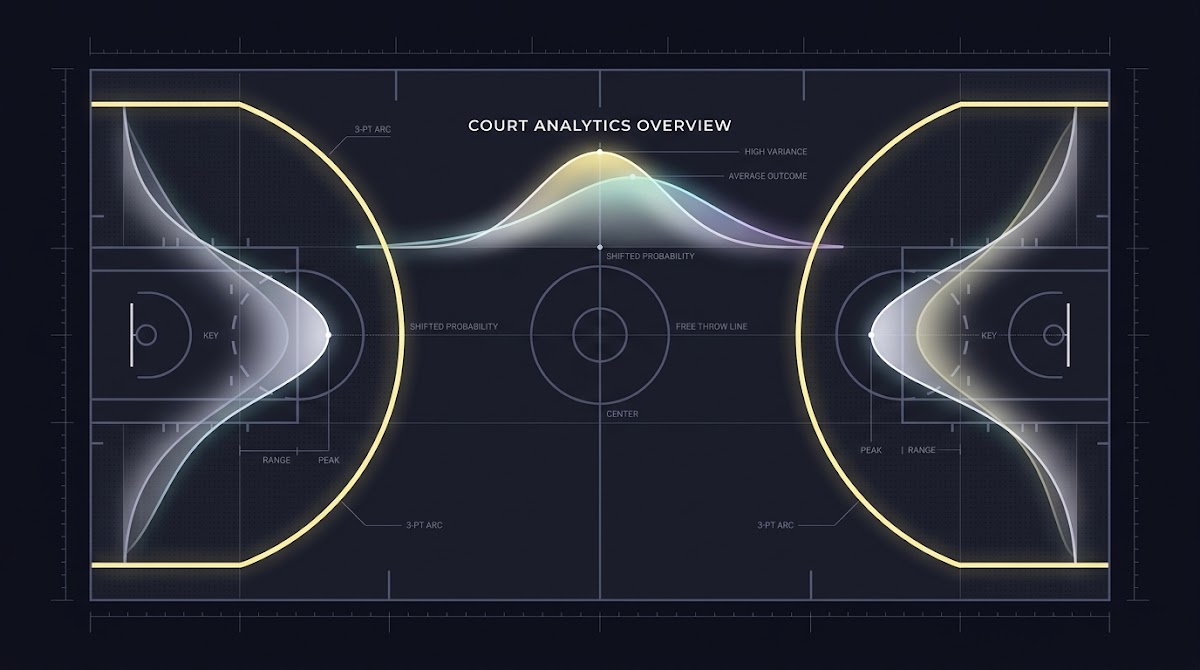
What three-point variance means for NBA outcomes
Definition of three-point variance and relevant metrics
Three-point variance refers to the game-to-game fluctuation in teams' three-point shooting outcomes, distinct from a season mean 3P%. In practice, analysts track both central tendency and dispersion: season 3P% gives an average ability signal while game-level variance captures how much a team's three-point performance can deviate on any given night. A useful way to frame this is that a season mean is the baseline expectation, and variance is the probability a team will be well above or well below that baseline in a single game.
Key box score and rate stats that capture these concepts include 3PAr, 3P%, attempts per game, and makes above expectation. 3PAr indicates how much a team relies on perimeter shots relative to other scoring options, while attempts per game and makes above expectation show the volume and realized deviation that drive scoring swings. The distinction between mean and variance matters because the same average 3P% with higher attempts produces larger absolute swings in points when shooting deviates.
Intuitively, two teams can have identical season 3P% but very different game-to-game behavior if one shoots many more threes. The team with higher attempt volume will experience larger single-game point swings when shooting luck runs hot or cold, even though long-term expectation may be the same. This is why variance is not redundant with mean performance and must be modeled separately, particularly for single-game forecasting and upset risk assessment.
Empirical research has shown that game-to-game variance in team 3P% exceeds the variance seen for two-point attempts, which makes single-game results particularly sensitive to perimeter shooting swings, and this fact underpins many of the modeling approaches discussed later in the article Journal of Quantitative Analysis in Sports study and related analysis Live by the Three.

How three-point volume has shaped modern scoring dynamics
Trends in league 3PT attempts and makes
Through the 2024-25 season, league-level three-point attempt rate and makes stayed at or near all-time highs, so three-point volume is a central driver of modern NBA scoring dynamics. That elevated volume means perimeter outcomes carry greater leverage over outcomes than in prior eras, and teams that prioritize spacing and pace amplify the effect of any shooting deviation on final scores NBA league averages and season metrics.
When teams increase three-point volume, an atypical hot or cold shooting night produces a larger net point swing than would be true in a low-volume era. Put another way, a plus-three made threes night is worth more absolute points when a team is taking many threes, and that changes how often underdogs can prevail on any given night.
Offensive strategies that emphasize spacing and pace trade more single-game volatility for higher expected value, because more three-point attempts raise expected points per possession but also increase scoring variance; recent season reporting outlines that strategic trade-off in league coverage and analysis NBA.com trend summary.
Explore practical simulation guides and challenge resources
Explore the rest of this article to see step-by-step simulation guidance and practical rules of thumb for incorporating 3PT variance into forecasts. Consider following platform updates for model-ready resources and example notebooks.
The math behind variance, sample size, and regression to the mean
Sampling error and why percentages swing game to game
At a technical level, three-point attempts behave like binomial or near-binomial events where observed 3P% in a game is a sample-based estimate of a true shooting probability. Because the number of opportunities per game is limited, sampling variance can be substantial, producing frequent deviations from season-average percentages. For three-point attempts, peer-reviewed work finds that game-to-game variance is larger than for two-point attempts, which helps explain why perimeter shooting drives single-game volatility more strongly than interior shots Journal of Quantitative Analysis in Sports study and related statistical discussion SAGE article.
Three-point variance amplifies single-game volatility because of sampling variation and high three-point volume; possession-based Monte Carlo simulations calibrated to contemporary league rates provide a principled method to convert made-three deviations into win-probability changes while accounting for pace, shot-quality, and opponent context.
When you simulate scores or estimate win probabilities, failing to account for sampling variance at the shot level will understate the chance of extreme outcomes, because small-sample noise can produce outsized score swings relative to mean-based forecasts.
How regression to the mean works across multi-game samples
As sample size grows, random deviations average out and observed percentages converge toward the underlying ability, which is the phenomenon of regression to the mean. Over a multi-game sample such as a seven-game playoff series, regression reduces the expected impact of atypical shooting nights, though it does not remove the possibility that a few extreme performances shift the series result. Simulation studies demonstrate that while a single hot shooting night can flip a game, it takes multiple extreme events to systematically alter a series probability distribution MIT Sloan Sports Analytics Conference paper.
Understanding the interplay of variance and sample size helps analysts set realistic expectations about when short-term shooting patterns should influence forecasts and when they are best treated as noise to be expected and downweighted.
Simulating the effect: possession-based Monte Carlo for 3PT swings
Overview of possession-based Monte Carlo approach
Possession-based Monte Carlo simulation models full possessions and shot outcomes rather than directly perturbing final scores. This approach more naturally represents how three-point attempts, shot selection, turnovers, and free throws interact across possessions, and it allows calibration to league-level possession rates and shot distributions. For quantifying the effect of extra made threes, possession-level simulation yields more realistic win-probability shifts than simpler score-noise perturbation methods MIT Sloan Sports Analytics Conference paper.
Calibration inputs: league 3P% and attempt distributions
quick estimation of extra points from made three swings
use for sensitivity checks
After calibration, the simulation runs many randomized game trajectories where three-point outcomes are sampled according to shot-level probabilities. Analysts can then measure how deviations in made threes versus expectation map to changes in win probability across many simulated trials, and produce distributions of possible game margins and win odds.
How three extra made threes affects single-game win probability
Reported win-probability shifts from calibrated simulations
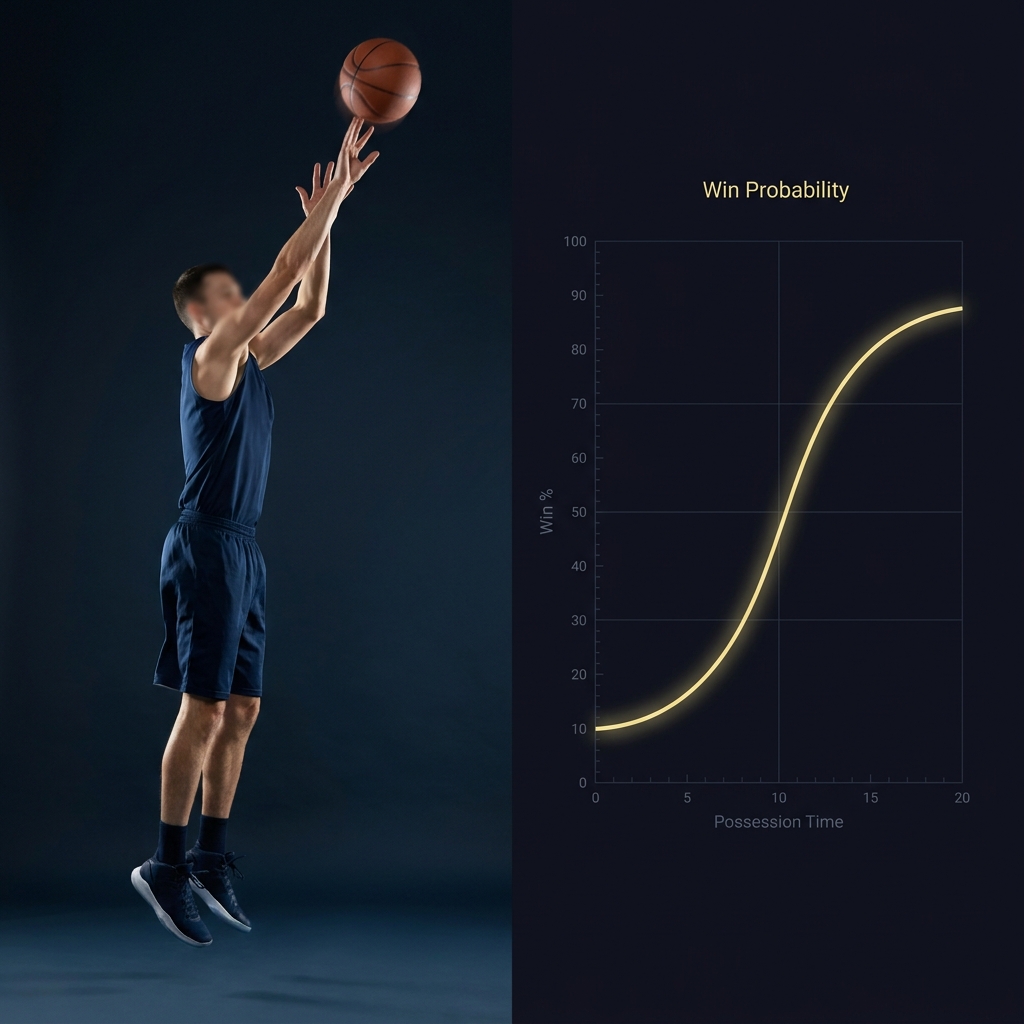
Possession-based Monte Carlo simulations calibrated to 2024-25 league averages commonly show that a positive deviation of two to three made threes relative to expectation can move win probability by a substantial amount, often in the range of roughly 15 to 25 percentage points depending on contexts like team quality and pace. This scale is conditional on calibration choices and baseline assumptions, but it highlights why a single hot shooting night can materially change outcome likelihoods MIT Sloan Sports Analytics Conference paper.

Because the effect size is conditional, the same plus-three made threes often has different practical impacts for favorites and underdogs. For favorites, a three-made advantage may simply widen an already large win probability. For underdogs, the same advantage can transform a long-shot into a genuine upset possibility. Analysts should therefore avoid treating a made-three swing as a fixed win-probability delta and instead measure it relative to baseline probabilities and matchup characteristics on our blog.
Dependence on baseline team quality and pace
Why context changes the impact
Baseline team quality sets the starting win probability and therefore modulates how much a given scoring swing changes the final odds. High-pace games provide more possessions, which can both increase opportunities for mean reversion and also inflate the expected point value of volume-driven strategies. As a result, a three-made advantage in a fast-paced matchup may play out differently than the same advantage in a slow, low-possession contest NBA league averages and metrics.
Model sensitivity to pace and opponent defensive tendencies means that simple heuristics are useful but never sufficient; possession-level simulation that conditions on team pace and expected shot distributions gives more reliable translations from made-threes deviations to win-probability changes.
Series and playoff context: why regression helps but does not eliminate 3PT risk
Seven-game sample dynamics

That said, regression to the mean reduces risk but does not eliminate it. If an underdog strings together two or three extreme shooting nights early in a series, the cumulative effect can create an upset even though each night individually is a noisy event. Analysts and coaches should therefore model both the mean-reverting pressure of series samples and the tail risk from clustered extreme performances MIT Sloan Sports Analytics Conference paper.
Modeling implications for forecasting and competitive predictors
Why attempt volume and shot-quality features improve calibration
Forecast models that include attempt volume and shot-quality context outperform approaches that rely solely on raw 3P%, because volume controls how much deviation matters and shot-quality helps separate skill from luck. Including features like three-point attempt density by lineup and expected points per shot yields better-calibrated probabilities in backtests than models that use 3P% in isolation Journal of Quantitative Analysis in Sports study.
Practically, this means adding inputs such as 3PAr, per-lineup expected value metrics, and spatial shot-quality indicators to a forecasting pipeline, and ensuring the model is retrained or recalibrated to 2024-25 baselines to reflect current league tendencies NBA advanced season summary.
Adjusting for opponent shooting luck
Opponent shooting luck matters because a single opponent's hot shooting can make a defensive unit appear worse than its true baseline. Adjusting model inputs for opponent 3PT luck or expected makes based on attempt profile and shot-quality prevents overreacting to recent noisy performances, and improves out-of-sample calibration.
Strategic trade-offs for teams: higher EV versus higher variance
Why teams accept more variance to raise expected value
Teams and coaching staffs increasingly accept greater single-game variance because the expected value of additional spacing and three-point volume can outweigh the cost of occasional upsets. Media and league analysis from recent seasons document this trend as a tactical choice rather than a mistake, and teams manage rosters and rotations to maximize expected points even if that increases game-to-game outcome dispersion ESPN analysis of the 3-point revolution.
From a decision-making standpoint, accepting variance is rational when season-long goals reward expected value, such as playoff seeding or cumulative challenge performance, but coaches may alter lineups or defensive schemes in playoffs where individual games have larger strategic weight.
Defensive countermeasures and scheme evolution
Defenses respond by prioritizing contesting perimeter shots, switching to limit open catch-and-shoot looks, and using lineup mix to reduce high-quality three-point chances. These countermeasures change both the mean and variance of three-point outcomes, and continued evolution in schemes or rule interpretations can alter the EV versus variance trade-off in future seasons.
Decision criteria: when analysts should adjust forecasts for 3PT variance
Signal versus noise: sample thresholds and flags
Set simple thresholds to decide when short-term shooting moves are informative. For example, treat multi-game deviations across a minimum shot threshold as a candidate signal, but downweight single-game extremes unless corroborated by shot-quality indicators or sustained volume changes. Using sample thresholds helps separate random noise from candidate changes in underlying performance Journal of Quantitative Analysis in Sports study.
Recommended flags to monitor include deviations in attempts per game versus season baseline, a rise in open-shot percentage by shot location, and sustained changes in lineup three-point distribution. When multiple flags align, increase the weight of recent shooting in the forecast; otherwise, revert toward baseline.
When to lean into recent shooting versus revert to baseline
If a shooter or team posts several high-volume, high-quality shooting performances and those nights are supported by strong shot-quality metrics, recent shooting deserves greater influence in short-term forecasts. Conversely, if the deviation stems from a single-game fluke with low-quality attempts, treat it as noise and give priority to season baselines and stability checks.
Common modeling errors and pitfalls to avoid
Overfitting to short-term hot streaks
One frequent error is overfitting models to short-term hot streaks that are sampling noise. This causes forecasts to be unstable and produces poor calibration in backtests. Use holdout validation and explicit shrinkage toward season means to mitigate overfitting, and prefer features that capture attempt volume and shot quality rather than raw short-term 3P% spikes NBA league metrics reference.
Using raw 3P% without attempt context
Another common pitfall is treating raw 3P% as a fully sufficient statistic. Without attempt counts and shot-quality context, 3P% can be misleading. Models should incorporate per-game attempt distributions and expected makes given shot locations to avoid overweighting noisy performance signals Journal of Quantitative Analysis in Sports study.
Validation checks such as recalibrating predicted upset frequencies against historical outcomes and running counterfactual simulations where shooting luck is randomized help detect these mistakes and improve model robustness.
Practical example: walkthrough of a game-level simulation
Sample inputs and expected outputs
To run a simple possession Monte Carlo, start with inputs calibrated to 2024-25 league norms: possession count for the match, baseline per-possession scoring rates, league 3P% and team 3PAr, and expected three-point attempts for the lineup in question. Using these inputs, simulate many game trajectories where each possession samples a shot outcome based on shot-level probabilities and shot-type frequency, and record win/loss outcomes and margin distributions NBA advanced season summary.
A straightforward output set includes the distribution of simulated margins, the empirical win probability for the team, and the sensitivity of win probability to incremental made-three swings. Analysts can then report how a +1, +2, or +3 made-threes deviation shifts the simulated win probability and examine how that shift varies with pace and opponent defense assumptions.
Interpreting results and sensitivity checks
When interpreting simulation outcomes, always run sensitivity checks: vary the league 3P% baseline within plausible bounds, adjust the expected number of attempts, and re-run with different opponent defensive profiles. Sensitivity analysis reveals how fragile the win-probability shift estimates are to calibration choices and helps set confidence intervals around reported effects.
Checklist: building a robust 3PT-aware forecasting pipeline
Required data and calibration steps
Core data needs include up-to-date league averages for pace and efficiency, per-team and per-lineup three-point attempt distributions, shot-location quality metrics, and possession counts. Calibrate baseline probabilities to 2024-25 season norms and document the calibration process so it can be rerun when league tendencies shift NBA league averages and season metrics.
Set up a routine of backtests that compare predicted upset rates to observed outcomes, monitor calibration metrics over rolling windows, and create alerts when model miscalibration exceeds thresholds. Periodically retrain or recalibrate using recent windows that include the latest season data to maintain alignment with evolving shot distributions and defensive schemes MIT Sloan Sports Analytics Conference paper.
Case studies and scenarios: underdog wins and hot-shooting upsets
Typical upset pattern driven by 3PT variance
A common upset pattern begins with an underdog getting multiple early open looks and converting at an above-expectation rate, producing an early lead that forces the favorite into riskier play and higher variance possession choices. If the underdog sustains a couple of extreme shooting nights across a short series, that early advantage can compound into a series win despite long-run talent gaps Journal of Quantitative Analysis in Sports study and see further discussion The NBA's 3-point Variance Lie.
When analysts narrate these games, it is important to distinguish luck-driven events from structural changes in shot quality or lineup composition. If high-quality shot indicators do not support a sustained improvement, label the performance as likely luck-driven to avoid overstating durable changes.
A balanced conclusion: what three-point variance means for prediction, strategy, and fans
Key takeaways
Three-point variance amplifies single-game outcome volatility in a league where three-point volume is high, so game-level forecasting must model shot-level variance, attempt volume, and shot quality to produce calibrated probabilities. Possession-based Monte Carlo simulations calibrated to 2024-25 league rates provide a practical way to translate made-three deviations into win-probability shifts without overclaiming certainty MIT Sloan Sports Analytics Conference paper.
For analysts and competitive predictors, the practical response is clear: include attempt-volume and shot-quality features, adjust for opponent shooting luck, and maintain disciplined validation and monitoring to avoid overreacting to short-term noise Journal of Quantitative Analysis in Sports study. For more on our approach, see our evaluation methodology.
Appendix suggestions for the writer: sources, visualizations, and code notes
Recommended charts and tables
Useful visualizations include the distribution of game-level 3P% versus season mean, win-probability shift curves for +1 through +4 made threes across different baselines, and possession-level example traces to show how shot outcomes create margin volatility. These charts help readers intuitively see how variance translates into outcome risk and should be paired with clear captions and calibration notes.
Data and code hygiene reminders
Document random seeds, calibration windows, and exact league references used for baselines. Cite Basketball-Reference and NBA stats pages for aggregated league metrics, and include reproducible notebooks showing calibration steps so results can be audited and updated as new seasons provide fresh data Basketball-Reference league metrics and visit Funded Plays for resources.
Because three-point attempts have larger game-to-game sampling variance, unusual shooting nights can swing single-game win probabilities markedly even when season-long ability is unchanged.
Not always; adjust forecasts if the performance is backed by sustained volume and shot-quality indicators, otherwise downweight single-game deviations toward baseline.
Yes, possession-based Monte Carlo simulations calibrated to current league rates can estimate how made-three deviations shift win probabilities and upset likelihoods.
References
- https://www.degruyter.com/document/doi/10.1515/jqas-2023-0123/html
- https://www.sloansportsconference.com/research-papers/live-by-the-three-die-by-the-three
- https://www.basketball-reference.com/leagues/NBA_stats.html
- https://www.nba.com/news/by-the-numbers-2023-24-regular-season
- https://www.sloansportsconference.com/research-papers/estimating-win-probability-in-basketball-using-possession-based-monte-carlo-simulation
- https://www.nba.com/stats/league/advanced
- https://www.fundedplays.com/challenges
- https://journals.sagepub.com/doi/10.1177/15270025231222630
- https://www.binomialbasketball.com/p/the-nbas-3-point-variance-lie
- https://www.espn.com/nba/insider/story/_/id/40234567/nba-3-point-revolution-by-numbers
- https://www.fundedplays.com/blogs
- https://www.fundedplays.com/blogs/how-fundedplays-evaluations-work
- https://www.fundedplays.com