
What performance evaluation means for sports trading platforms
Performance evaluation on a skill-focused sports prediction platform describes how the platform measures a participant's forecasting and staking outcomes in a simulated or virtual funded-account context, rather than raw wagering results. This distinction matters because evaluations normally track outcomes using virtual bankrolls, defined drawdown limits and qualification thresholds that shape whether a user advances to larger funded accounts.
Look at multiple measures: ROI for profitability, a risk-adjusted ratio for consistency, maximum drawdown for sequence risk, a proper scoring rule for probabilistic quality, and CLV to detect market edge.
In practice, a platform-level evaluation combines headline figures such as cumulative ROI with path-dependent and probabilistic measures so that a single success streak does not mask risky behavior that would jeopardize a funded account. Platforms use these evaluations to set qualification thresholds, design progression rules, and implement safeguards that support responsible participation.

Return on investment, or ROI, is the basic profitability measure platforms show; it is typically the ratio of net profit to starting bankroll expressed as a percentage. Platforms may publish cumulative ROI over a challenge period or periodic ROI broken out by week or month to show how returns evolved over time, and readers should note which form is shown.
Hit rate reports the share of correct predictions, while expected value combines probability estimates and odds to show the average long-run gain per stake. Both metrics complement ROI: hit rate reveals frequency of success and expected value connects stated probability to economic outcomes. When platforms present these numbers, clear disclosure of whether figures are net of fees, holds or simulated transaction costs matters for comparability with other records
Trustworthy platform reports disclose raw event records, the timeframe covered, sample sizes and whether reported numbers are net of fees or holds. These disclosure items allow users to audit claims and compare performance across providers.
Users should ask whether reported results include any costs or platform hold assumptions, because net-of-costs treatment can materially change how ROI and expected value should be interpreted. Platforms that follow clear reporting practices will explicitly state if numbers are gross or net of platform fees.
Core profitability metrics platforms report: ROI, hit rate and expected value
Return on investment, or ROI, is the basic profitability measure platforms show; it is typically the ratio of net profit to starting bankroll expressed as a percentage. Platforms may publish cumulative ROI over a challenge period or periodic ROI broken out by week or month to show how returns evolved over time, and readers should note which form is shown.
Hit rate reports the share of correct predictions, while expected value combines probability estimates and odds to show the average long-run gain per stake. Both metrics complement ROI: hit rate reveals frequency of success and expected value connects stated probability to economic outcomes. When platforms present these numbers, clear disclosure of whether figures are net of fees, holds or simulated transaction costs matters for comparability with other records

Users should ask whether reported results include any costs or platform hold assumptions, because net-of-costs treatment can materially change how ROI and expected value should be interpreted. Platforms that follow clear reporting practices will explicitly state if numbers are gross or net of platform fees.
Risk-adjusted measures: volatility, the Sharpe ratio and why they matter
Volatility measures how widely returns swing around their average and helps show whether similar ROI figures hide wildly different day-to-day experiences. For example, two strategies with the same average return can feel very different if one produces steady small gains while the other alternates big wins and steep losses.
The Sharpe ratio is a commonly used risk-adjusted metric that compares excess return per unit of return variability; platforms use it to compare strategies on a risk-adjusted basis rather than by raw ROI alone, which helps surface approaches that deliver more consistent outcomes Investopedia Sharpe Ratio article.
Practical caveats matter: many sports prediction return streams are nonnormal, samples can be short, and occasional large wins or losses distort volatility-based comparisons. Readers should treat the Sharpe ratio as informative but not definitive, and check complementary metrics that capture path-dependent risk.
Path-dependent risk: maximum drawdown and why platforms track it
Maximum drawdown captures the largest peak-to-trough loss an account experienced and is a direct measure of the worst decline a participant would have faced during a given period. It expresses the largest percentage drop from a high point to the subsequent low and therefore reflects the real sequence of gains and losses.
Because maximum drawdown records peak-to-trough losses, it reveals behavioral and practical risks that volatility can miss; for example, a steady sequence of small losses that compounds into a large drawdown can be more damaging for a funded-account rule set than infrequent large variance in both directions Investopedia Maximum Drawdown guide.
Platforms often report drawdown alongside ROI and Sharpe so users and reviewers can see both overall profitability and the worst-case account declines that occurred within the reporting window.
Platforms often report drawdown alongside ROI and Sharpe so users and reviewers can see both overall profitability and the worst-case account declines that occurred within the reporting window.

Evaluating probabilistic forecasts: Brier score and log loss
Strictly proper scoring rules are statistical measures that reward honest probability estimates and penalize miscalibration; this property makes them well suited to evaluate probabilistic sports forecasts where the quality of probability statements matters as much as raw outcomes. Proper scoring rules help determine whether a model is well calibrated and discriminative when assigning event probabilities JASA paper on strictly proper scoring rules arXiv superior scoring rules.
The Brier score measures the mean squared difference between forecast probabilities and actual outcomes, giving an intuitive sense of calibration error, while log loss strongly punishes overconfident, wrong probability estimates and highlights discrimination between likely and unlikely outcomes. Platforms that track both can show whether a forecaster's probabilities are honest and whether those probabilities translate into good decisions when staking rules are applied.
Combining probabilistic scoring with bankroll and ROI metrics lets platforms judge both the statistical quality of forecasts and their economic impact, helping differentiate a well-calibrated model that does not produce profits from a profitable but poorly calibrated approach.
Stake sizing: Kelly, fractional Kelly and practical caps
The Kelly criterion offers a theoretical fraction of bankroll to stake on an edge given stated odds and estimated win probability; it is a foundational concept for sizing bets under a logarithmic utility objective and informs why larger edges suggest larger stakes in principle original Kelly interpretation paper.

In practice, platforms and participants commonly use fractional Kelly or conservative caps to limit drawdown and smoothing of outcomes, because full Kelly can produce large volatility and sequence risk. How a platform applies stake-sizing rules affects reported ROI and drawdown patterns and therefore influences qualification outcomes for funded accounts.
Users should check whether reported results assume a particular staking rule, whether stakes were optimized mechanically or chosen by users, and whether the platform enforces caps or uses a fractional Kelly approach to preserve funded pools and participant longevity.
Closing Line Value: a practical benchmark for market edge
Closing Line Value, or CLV, measures whether a user or model consistently posts prices that are better than the market's closing price; practitioners treat persistent positive CLV as evidence of a forecasting edge because beating the close suggests information or timing advantage relative to the market consensus Pinnacle Closing Line Value explanation.
CLV is sensitive to sample size and market liquidity, and a short run of positive CLV can occur by chance. Platforms that report CLV alongside ROI and probabilistic scores give a more complete picture: CLV can indicate whether a participant is capturing value even when net economic returns are modest, and it complements scoring-rule measures that evaluate probability quality.
Transparent reporting: data sources, timeframes and net-of-cost disclosure
a reporting checklist users can request from platforms
include start and end dates
Financial reporting standards emphasize similar principles: clear disclosure of data sources, timeframes and whether results are net of costs supports comparability and user trust, and platforms adapting these ideas improve transparency for participants and reviewers CFA Institute GIPS standards.
When evaluating reported outcomes, users should confirm whether the record contains raw tip or trade logs, whether outcomes are shown gross or net of platform fees, and whether any manual adjustments were applied to the published results.
Putting metrics together: dashboards, scorecards and decision frameworks
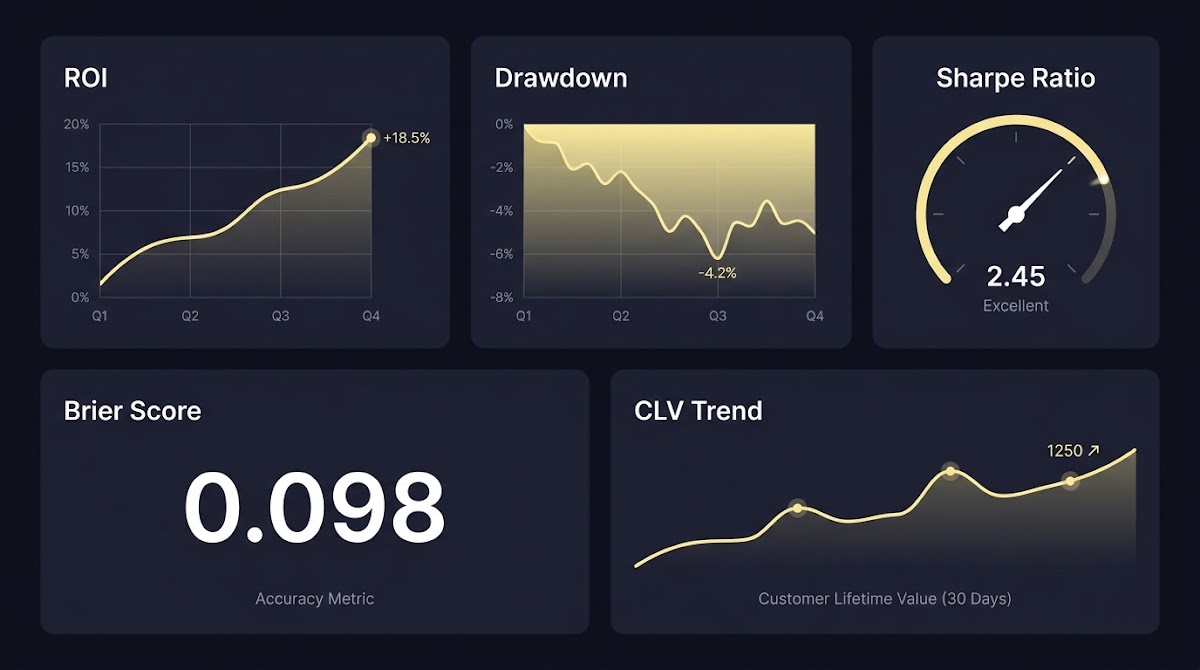
A practical dashboard combines profitability, risk and probabilistic metrics so users see ROI, a risk-adjusted ratio such as Sharpe, maximum drawdown, a Brier or log loss score and CLV at a glance. Presenting several measures prevents gaming of a single metric and encourages a balanced view of performance.
A sample scorecard might list numeric values and short qualitativeflags for each metric, for example: ROI (period), Sharpe ratio (annualized or scaled), max drawdown (period), Brier score and recent CLV trend. Weighting choices depend on a platform's objectives: a funded-account operator may give extra weight to drawdown control and CLV to protect pooled capital and assess persistent edge Investopedia Sharpe Ratio article.
Dashboards should also include signals that trigger manual review, such as very small sample sizes, divergent metric directions (for instance high ROI with poor probabilistic scores), or sustained positive ROI driven by a handful of outcomes, so that moderators can investigate potential data errors or rule violations.
Decision criteria platforms use: thresholds, sample-size rules and net-of-cost assumptions
Platforms operationalize evaluations with decision levers such as minimum number of events, minimum ROI or CLV thresholds and maximum allowed drawdown. These thresholds balance the desire to reward skill with protecting pooled virtual funds and maintaining a predictable progression process.
Sample size rules and net-of-cost assumptions materially influence pass or fail outcomes: small samples make metrics unstable, and assuming gross returns versus net-of-costs can flip whether a participant meets a qualification threshold. Platforms that disclose assumptions and conservative caps or fractional Kelly practices make it easier for users to interpret qualification decisions original Kelly interpretation paper.
Common mistakes and interpretation traps users should avoid
Survivorship bias makes published historical results look better than reality when underperforming records are removed or ignored, so readers should ask for full raw logs rather than summary snapshots. Short samples tend to exaggerate apparent skill because luck plays a larger role when only a few events are included.
Over-reliance on a single metric is another common trap: a high Sharpe ratio can be misleading if the return distribution has fat tails or if maximum drawdown was severe. Cross-checking Sharpe with drawdown and probabilistic scoring helps detect these issues Investopedia Sharpe Ratio article.
Practical scenarios: three worked examples showing metric trade-offs
Scenario A: high ROI with large drawdowns
Imagine a challenge account that posts a 40 percent ROI over a quarter but experienced a 55 percent peak-to-trough decline during that period. While headline ROI appears attractive, the large drawdown signals that the account underwent severe sequence risk that could have disqualified it under typical funded-account rules. Platforms reviewing such a record would likely weigh drawdown heavily before approving progression.
Scenario B: calibrated probabilities with low economic return
Consider a user whose probability forecasts score well on Brier and log loss, indicating solid calibration, but who posts modest or negative ROI because staking choices were conservative or market prices offered little edge. In this case, the probabilistic scores show forecasting skill, but the economic impact is limited; platforms may value such statistical quality while also noting that staking rules or market conditions constrained profitability JASA paper on strictly proper scoring rules.
Scenario C: modest ROI with consistently positive CLV
A participant with moderate ROI but consistently positive CLV suggests they find value relative to the closing market price even if short-term economic returns are small. Persistent CLV can indicate a timing or information advantage that could translate into better returns under different staking rules or with more scale, so platforms often interpret CLV trends as a complement to ROI and scoring metrics Pinnacle Closing Line Value explanation.
How users can audit platform performance reports and what to ask
Request a raw event log for the period in question, confirm the start and end dates, and check the sample size for stability. Ask whether results are presented gross or net of fees, and whether any post-hoc edits or exclusions were applied to the published record.
Specific questions to pose to platform support or community reviewers include: which staking rule was used for the reported results, is CLV provided and calculated consistently, and were any manual adjustments made to event outcomes or timestamps. Triangulating platform claims with independent indicators such as CLV trends and scoring-rule summaries helps validate reported performance CFA Institute GIPS standards.
Conclusion: what trustworthy performance evaluation looks like and next steps
Trustworthy evaluation uses multiple complementary metrics, transparent disclosures, and attention to path-dependent risk: combine ROI, a risk-adjusted ratio, maximum drawdown and a probabilistic score to get a full picture. Require clear disclosure of data sources, timeframes and net-of-cost treatment before drawing conclusions.
Standards may evolve toward cross-platform reporting conventions that integrate probability scoring with bankroll metrics and standardized net-of-cost assumptions. For now, users should verify raw logs, ask targeted questions, and treat past performance as informative but not deterministic of future results.
Review your account metrics now
Review your account volatility and recent return swings now to see whether a high headline ROI hides large variability you would rather avoid.
CLV compares the price you posted to the closing market price and signals timing or market-edge advantages, while ROI measures net profit relative to bankroll over a period.
Maximum drawdown shows the largest peak-to-trough loss and captures the sequence risk participants faced, which volatility measures can miss.
Ask for raw event logs with timestamps, the exact timeframe and sample size, staking assumptions, and whether reported figures are net of fees.
References
- https://www.fundedplays.com
- https://www.fundedplays.com/blogs/how-fundedplays-evaluations-work
- https://en.wikipedia.org/wiki/Brier_score
- https://www.stat.washington.edu/raftery/Research/PDF/Gneiting2007jasa.pdf
- https://www.investopedia.com/terms/s/sharperatio.asp
- https://www.investopedia.com/terms/m/maximum-drawdown-mdd.asp
- https://www.fundedplays.com/blogs
- https://datascience.oneoffcoder.com/log-loss.html
- https://arxiv.org/html/2407.17697v1
- https://onlinelibrary.wiley.com/doi/10.1002/j.1538-7305.1956.tb03809.x
- https://www.fundedplays.com/challenges
- https://www.pinnacle.com/en/betting-resources/education/closing-line-value-explained
- https://www.cfainstitute.org/en/ethics-standards/codes/gips-standards