

What special teams are and why they matter
How Special Teams Influence NHL Outcomes begins with the game states created by penalties: power plays and penalty kills are distinct manpower situations that change who is on the ice and how teams attack and defend. The NHL defines these game states in its Official Rules, which set when a power play begins, how long it lasts, and how manpower can change during play Official Rules.
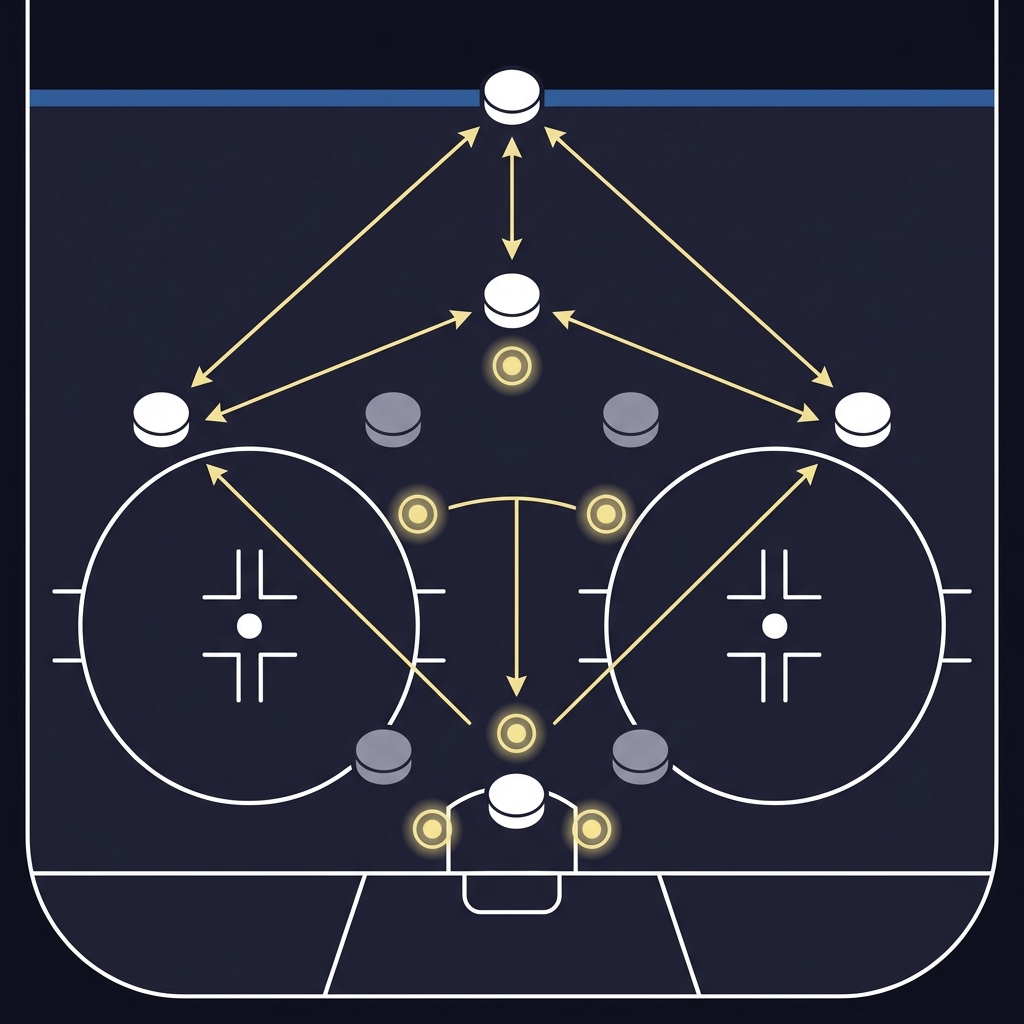
In simple terms, a power play means one team has a numerical advantage and the other is short a skater on the penalty kill. Those moments systematically change shot rates and the location of shots because teams facing fewer skaters accept more risk to cover passing lanes and block shots. Shorthanded goals, while less common, can quickly flip the scoreboard and momentum during these sequences; the leaderboards each season document both the typical distribution of power-play outcomes and the occasional shorthanded swing NHL.com glossary.
To see this in practice, picture a 5-on-4 sequence where the advantaged team circulates the puck at the top of the zone and generates more shots from the slot; those shots are both more frequent and often higher quality than peripheral attempts at even strength. That concentrated shot profile explains why special teams alter scoring context more than a simple tally of chances.
How NHL rules create and define manpower states
The NHL Official Rules explain which infractions produce single-minor, double-minor, major penalties, and how coincidental minors or delayed penalties alter on-ice manpower. These rule details matter because they determine when a power play starts, whether it ends on a goal, and how long a team remains shorthanded Official Rules.
Special teams alter shot rates and shot quality by creating manpower imbalances; when analysts measure those changes with xG and convert net special-teams goals into win-probability, they can estimate the likely effect on game and season outcomes.
For example, a delayed penalty keeps play going while the disadvantaged team attempts to touch the puck, and a stoppage then creates the power-play start once the offending player is penalized. That sequence changes the expected scoring environment because the advantaged team often already has an attacking zone set up when the whistle stops play.
Other special cases, such as coincidental minors where two players are penalized at the same time, can leave teams at even strength despite penalties being assessed, which reduces the frequency of power-play sequences in that game. Goalies can also be involved in rare situations that affect manpower, like when an attacking team pulls its goalie late in a period immediately after a penalty is assessed; these edge cases matter when building models that condition on manpower.

Measuring special-teams performance: PP%, PK% and their limits
Power-play percentage, commonly written PP%, and penalty-kill percentage, PK%, are the league-standard descriptive metrics that summarize how often a team converts on the power play or prevents goals while shorthanded; the definitions and glossary entries are published on NHL.com where seasonal leaderboards list team rankings and aggregates NHL.com glossary.
Those leaderboards are convenient for quick comparisons, but raw PP% and PK% have important statistical limits. Short samples can be noisy: shooting percentage and goaltender save variance cause conversion rates to swing in the short run without indicating a true change in team skill. The seasonal leaderboards also show substantial dispersion across teams year to year, so a single hot stretch can exaggerate a team’s apparent talent NHL.com team stats.
Because of this noise, analysts often treat PP% and PK% as starting points. A short callout for new readers: use those percentages to identify outliers, then drill into shot quality, personnel, and opponent context before forming a judgment.
Download the Special-Teams Checklist from FundedPlays Challenges
Download this one-page special-teams checklist to apply consistent checks when you see changes in PP% or PK%.
Why expected goals (xG) improves special-teams analysis
Expected-goals models explicitly condition on manpower state and shot quality, which separates the quantity of chances from their quality; this conditioning makes xG-based special-teams measures more stable and more predictive than raw conversion rates in many studies and applied methodologies MoneyPuck methodology.
Put simply, PP% mixes the effect of how many chances a team gets with how likely those chances are to become goals. An xG framework scores each shot by location, shot type, and context, producing a rate that reflects shot quality. That helps to reduce the influence of short-term shooting luck and goalie variance when comparing squads on power play efficiency or penalty kill xG. (see HockeStats methodology)
Quick reproducible xG-based net special-teams metric
Use rolling windows for stability
Applied work from public-analysis sites demonstrates that conditioning on manpower yields more consistent rankings across samples and seasons, because the model accounts for where shots originate and how manpower alters shot location distributions, and the Funded Plays blog also discusses related evaluation practices. That is why many analysts prefer a special teams expected-goals approach when projecting future performance Evolving-Hockey blog.
A practical framework to translate special-teams impact into expected wins
Start with a simple evaluative model: compute special-teams xG for and xG against over your chosen sample, add observed shorthanded goal events, and translate the net expected goals into an estimated win effect using a win-probability mapping that adjusts for manpower and score state. This stepwise approach keeps each component transparent and reproducible. (see Funded Plays) MoneyPuck methodology.

Conceptually, the framework has three steps you can implement in a spreadsheet: first, compute xG rates while conditioning on 5-on-4, 5-on-3, and other manpower states; second, combine those rates to produce a net special-teams xG per 60 or per game, adjusting for minutes of power play and penalty kill; third, map net special-teams goal differential into win-probability using an established model that includes manpower and score/time effects Win-probability model. (see The Importance of Special Teams in Ice Hockey)
Limitations are important to record: small samples inflate variance, goaltending can mask or exaggerate outcomes, and lineup changes or strategic shifts during a season alter the interpretation of a historical xG gap. Treat the framework as directional and update it with rolling windows to capture persistence before making firm predictions.
Common mistakes and analytical pitfalls
A common error is overweighting short-term swings in PP% and PK%. Because raw conversion rates are sensitive to shooting variance and goalie form, reacting to a 10-game stretch without confirming persistence often leads to incorrect conclusions. Analysts should check whether changes are supported by xG-conditioned metrics before updating beliefs Evolving-Hockey blog.
Another pitfall is ignoring contextual factors like score state, home versus away splits, and personnel changes. Teams trailing late in games may take more risks that change special-teams rates, and injuries or lineup rotations can materially change on-ice personnel that produced prior results.
Practical robustness checks include using rolling samples of xG for and against, comparing per-60 rates rather than raw counts, and examining multi-season persistence before elevating a short-term observation into a strategic conclusion. These steps reduce the chance of overfitting small patterns; see how evaluations work on Funded Plays here.
Practical examples and scenarios
Consider a team with a suddenly hot power play over 10 games. First, compute special-teams xG for and against during that span and compare those per-60 rates to the team’s longer-term baseline. If the xG lift reflects better shot locations and sustained setup play, it is likelier to persist than a raw spike in PP% driven solely by high shooting luck MoneyPuck methodology. (see Redefining the NHL's Special Teams Metrics)
Second, adjust for opponent quality and goalie matchups. A hot stretch against weak penalty-kill units or poor goaltending skews the estimate; comparing results to league averages and leaderboards helps contextualize whether the streak is unique or driven by schedule effects NHL.com team stats.
To translate net special-teams goal differential into expected wins, use a win-probability mapping that accounts for score and manpower. For instance, a net gain of one special-teams goal per 10 games can be turned into an estimated change in season win probability by applying a model calibrated to in-game goal impact under similar score states. This mapping is sensitive to when those goals occurred, so analysts should report a range rather than a single point estimate Win-probability model.
Finally, do not overlook shorthanded scoring. A pair of shorthanded goals in a single game can swing momentum and expected outcome far more than a single power-play goal, and those events should be tracked separately in your net special-teams metric to reflect their outsized game-level influence.
Actionable checklist and closing recommendations
Checklist for evaluating special teams: consult the relevant NHL rules for manpower context, use xG-conditioned rates for and against rather than raw conversion alone, include shorthanded goal events in net calculations, convert net goals to expected-win implications using a win-probability mapping, and run rolling-sample robustness checks before updating a predictive model NHL.com glossary.
In closing, special-teams analysis is a high-leverage area for understanding game outcomes because power plays and penalty kills create concentrated scoring opportunities. Combining rule-aware conditioning with xG and win-probability approaches produces more stable, actionable insights than relying on PP% or PK% alone. Keep assessments disciplined, update models with current season data, and treat short samples with caution.
PP% and PK% measure raw conversion rates reported on league leaderboards, while xG-based metrics score shots by quality and condition on manpower to reduce short-term noise.
Not on its own; short streaks can reflect shooting luck or opponent quality, so confirm persistence with xG rates and rolling samples before updating season projections.
Track shorthanded goals separately and include them in net special-teams calculations because they have outsized effects on momentum and game outcomes.
References
- https://www.nhl.com/info/official-rules
- https://www.nhl.com/info/nhl-glossary
- https://www.nhl.com/stats/teams?reportType=season&seasonFrom=20242025&seasonTo=20242025&gameType=2
- https://www.moneypuck.com/about.htm
- https://evolving-hockey.com/blog/special-teams-expected-goals-2023-24/
- https://doi.org/10.1515/jqas-2024-0000
- https://www.fundedplays.com/challenges
- https://hockeystats.com/methodology/expected-goals
- https://www.fundedplays.com/blogs
- https://www.fundedplays.com
- https://www.ida.liu.se/research/sportsanalytics/LINHAC/LINHAC23/papers/paper-research-LiU-special.pdf
- https://www.fundedplays.com/blogs/how-fundedplays-evaluations-work
- https://sportsanalytics.studentorg.berkeley.edu/articles/redefining-nhl-special-teams.html