
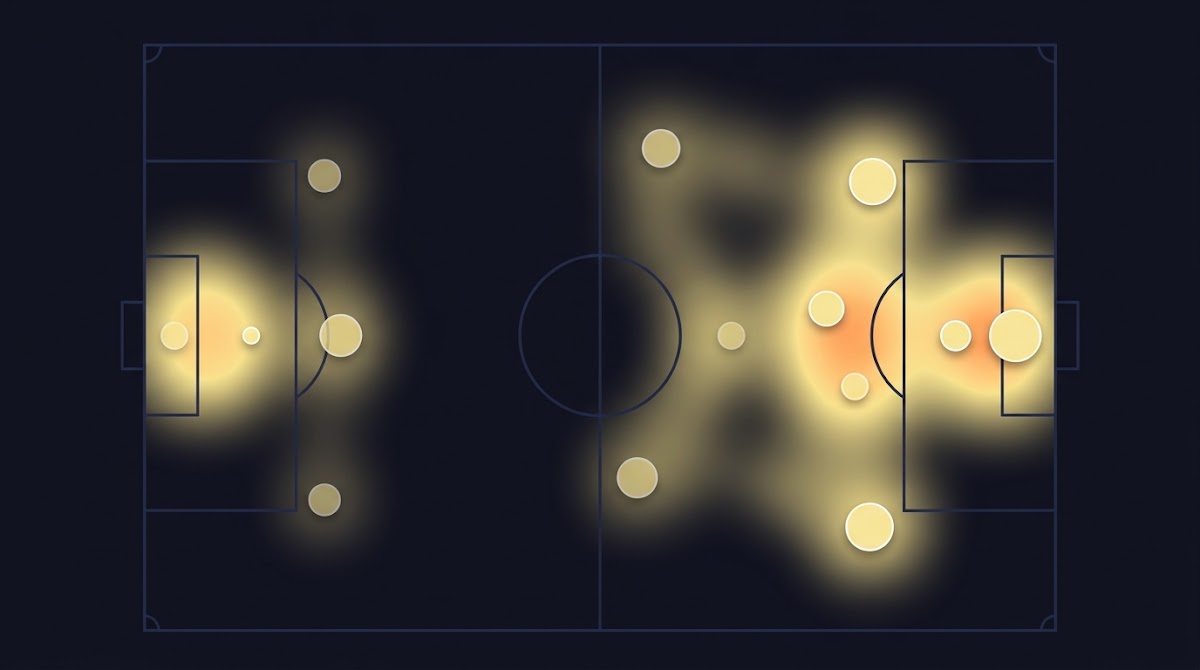
What we mean by shot quality and shot volume
Clear definitions: How Shot Quality Differs from Shot Volume
At its simplest, shot volume is a count: the number of attempts a team or player takes within a match or over a run of games. This measure captures activity and attacking intent but treats every attempt equally regardless of context, which is useful for some tactical summaries but limited when the goal is to estimate scoring likelihood.
Shot quality, by contrast, weights each attempt by its likelihood of resulting in a goal. Practitioners typically operationalize quality using expected-goals models that estimate a scoring probability for each shot based on factors such as location, angle and assist context; where available, models also use tracking inputs to refine those probabilities FIFA Training Centre.
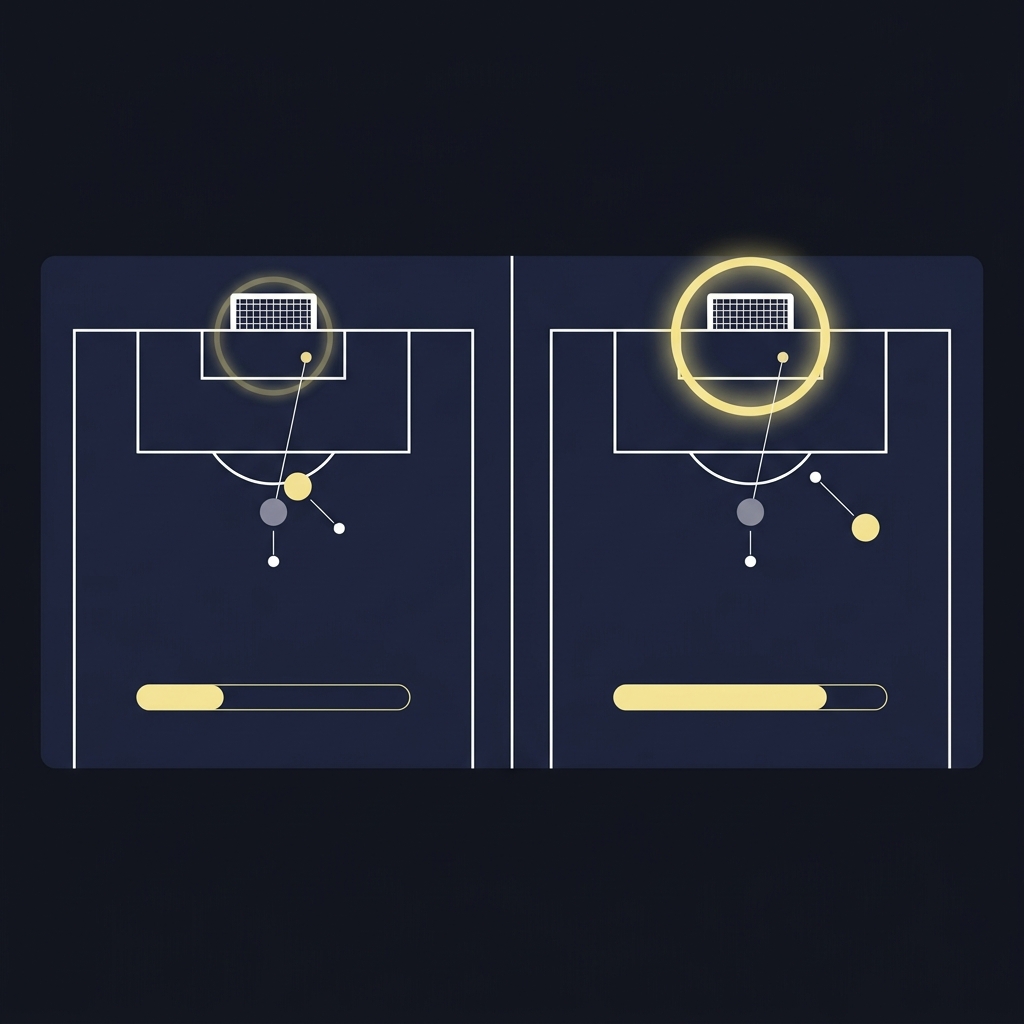
One clear practical effect is that two players with the same shot total can have very different offensive contributions because the chances they produce are not equally dangerous. For example, a squad that takes many long-range efforts will register high volume but low average chance value, while a side that creates fewer entries into the danger area can have a smaller shot total with higher expected output.
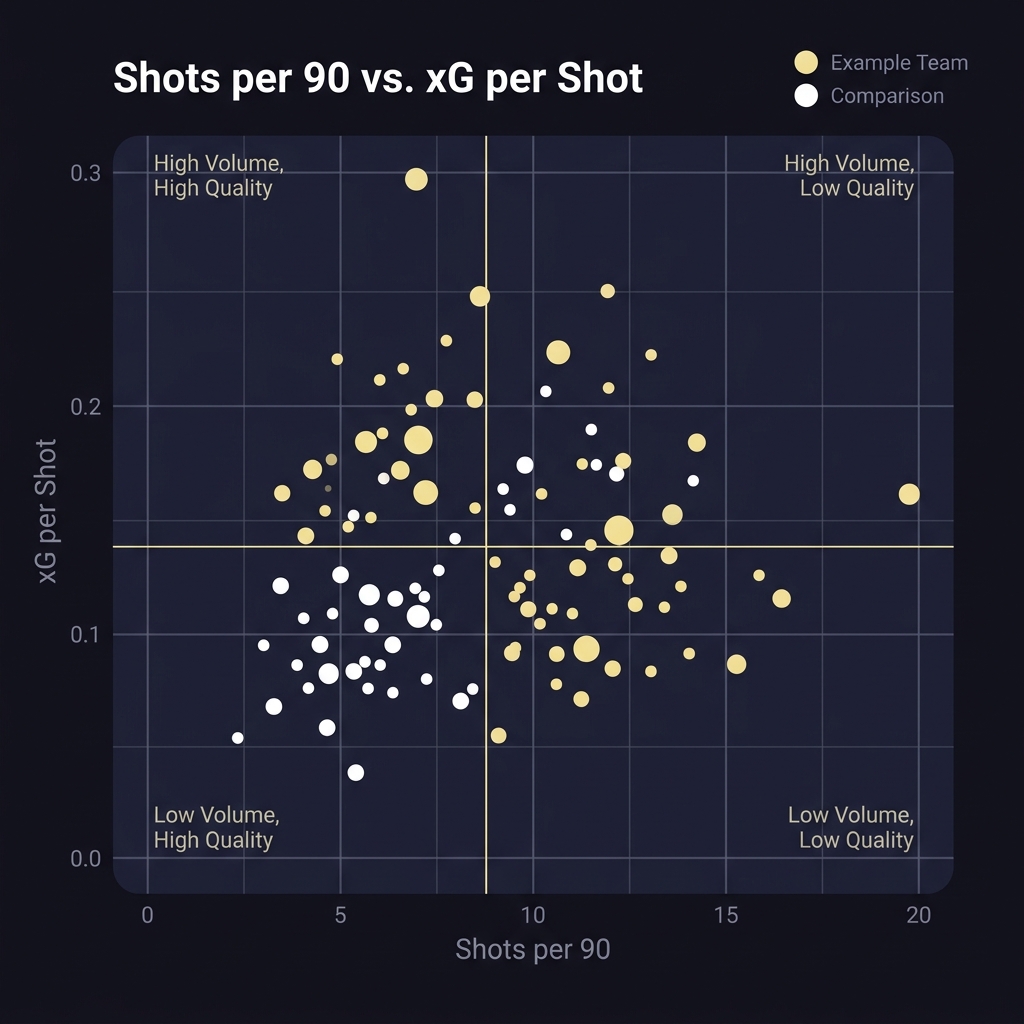
Analysts should view volume and quality as complementary: use shots per 90 to measure activity and xG per shot to measure chance value, combine them with rolling averages and annotate penalties so decisions reflect both frequency and efficiency.
Analysts should also note how special events are handled. Penalties, free-kick set pieces and spot kicks carry unusually high conversion probabilities and can dominate an xG total, so many evaluations separate non-penalty xG when comparing open-play finishing ability or chance construction.
Why the distinction matters for evaluation
Counting attempts answers a different question than estimating scoring probability. Shot volume tells you about pressure, opportunity creation and tactical aggressiveness, while shot quality tells you how likely those attempts are to become goals. Both are valid, but mixing them up leads to poor conclusions about finishing or chance creation.
For teams and analysts, that distinction changes what you track and how you respond. If a team has high volume but low quality, coaching attention may focus on shot selection and chance construction. If quality is high but volume low, the priority may be increasing penetrative actions or off-ball movement to create more of the good chances.
Why both metrics matter: the core framework
What each metric tells you about performance
Shot volume is a robust indicator of activity. Over longer samples it correlates with sustained pressure and possession-based dominance, and it helps identify systems that prioritize frequent attempts as part of their style. However, volume alone does not explain whether the attempts are likely to result in goals.
Average expected-goals per shot, often expressed as xG per shot, captures the efficiency of chance creation. A higher xG per shot means the average attempt carries a greater scoring probability and this measure is more predictive of goals than raw shot count when sample sizes are appropriate Opta Analyst. See HUDL for a concise definition of xG.
How to read volume and quality together
The practical consensus among analysts is to use both measures in tandem. For short and medium samples, combining shots and xG per shot stabilizes evaluation because volume indicates whether a team is creating opportunities while quality indicates how valuable those opportunities are; together they reduce volatility compared with using either metric on its own CIES Football Observatory.
A simple cross-check is to compute shots per 90 alongside xG per shot and non-penalty xG. If shots per 90 are elevated but xG per shot is low, that suggests wasted attempts. If xG per shot is high but shots per 90 are low, the team may convert at a high rate if volume increases, signaling a different tactical lever to pull.

How modern xG models define shot quality
Baseline inputs: distance, angle and body part
Across modern modeling work, distance and angle to goal remain the single strongest baseline predictors of scoring probability; close, central shots carry substantially higher expected conversion than long-range or wide-angle attempts Opta Analyst.
Models also account for body part and assist type. A well-placed header inside the six-yard box has different odds than a first-time volley from the edge of the area, and whether a chance follows a through ball, cross or set piece changes the expected value attributed to the attempt.
Tracking-era enhancements: defender and goalkeeper proximity
Where tracking data is available, adding defender pressure, goalkeeper positioning and blocking likelihood improves model discrimination. Those features reduce estimated scoring probabilities for heavily contested shots compared with location-only baselines, so contested attempts often see their xG lowered when pressure variables are included StatsBomb 360 announcement. See StatsBomb blog archive for additional context.
The practical upshot is that two shots from similar coordinates can have very different xG if one is under heavy pressure or partially blocked. As coverage of tracking data expanded through the mid 2020s, evidence showed that models incorporating pressure tend to outperform simpler baselines in validation studies, making the estimates more reliable for coaching decisions and scouting.
How to combine volume and quality in analysis
Practical metrics and visualizations
Start with a compact set of measures: shots per 90, xG per shot and non-penalty xG per 90. These three capture how often a team shoots, how valuable each attempt is on average, and the open-play scoring expectation without penalty distortion. Comparing these numbers side by side is often more informative than any single metric alone CIES Football Observatory.
For visualization, scatter plots are effective. Plot shots per 90 on one axis and xG per shot on the other, and use point size or color to encode non-penalty xG per 90. Such a chart immediately shows teams that combine high volume with high quality and those that are one-dimensional.
Rolling averages also help. A 6 to 12 match rolling average of xG per shot smooths random variation and highlights genuine shifts in chance construction. When rolling averages for xG per shot and shots per 90 move in opposite directions, that flags a trade-off worth investigating in tactical review.
Practical metrics and visualizations
Try a short analysis project that merges volume and quality
Try combining volume and quality in a small reproducible project: pick a six to 12 match window, compute shots per 90 and xG per shot, then visualize the two as a scatter with a rolling average overlay to see how team efficiency evolves.
When creating charts, annotate penalties and outliers. A team that benefits from multiple penalties in a window will show inflated xG totals; marking those events preserves transparency and avoids misleading stakeholders.
Decision criteria: when to trust volume, when to trust quality
Situations favoring shot volume
Volume is most informative in large samples or when a team demonstrates a sustained system that generates many attempts. Over a season, shot counts correlate with territory and possession dominance and can validate whether a system reliably forces opportunities against varied opponents Opta Analyst.
Volume can also indicate tactical intent. Teams that press high and create turnovers often show elevated shots per 90, and in those contexts volume signals where to focus training for finishing rather than structural chance creation changes.
Situations favoring shot quality
Quality should dominate judgment in small samples, tournament settings and scouting contexts where few events determine outcomes. Several tournament analyses have shown that teams with fewer, higher-quality chances can sustain favorable outcomes even without high shot counts, which matters for knockout competitions where sample size is limited UEFA technical reports.
When a coach investigates a player with low volume but high xG per shot, quality-focused evaluation helps decide whether that player needs more opportunities or a change in role to exploit a proven efficiency advantage.

Common mistakes and model pitfalls to avoid
Misreading sample noise
A frequent error is overinterpreting short runs of data. Small samples are noisy and can mislead if you equate a hot or cold scoring spell with sustainable skill. Always check rolling averages and confidence intervals before changing personnel or tactics.
Another related issue is conflating volume with efficiency. High shot totals can mask poor chance selection, and without quality measures you risk recommending the wrong interventions to coaches or players StatsBomb 360 announcement.
Overrelying on location-only models
Location-only xG models are useful baselines but they omit contesting pressure and blocking likelihood. When tracking-enhanced models are available, they typically reduce estimated scoring probabilities for contested attempts and improve predictive performance, so analysts should be careful applying location-only outputs without noting limitations Journal of Sports Analytics paper.
Reproducible analysis notebook template for shots and xG
Use documented inputs and annotate penalties
Data issues can also appear in raw event logs: blocked shots, rebounds and inconsistent shot attribution change summary totals. Good practice is to harmonize definitions and, where possible, cross-check with event and tracking feeds; see how Funded Plays evaluations work.
Practical examples and scenarios
Interpreting a team with high shots but low xG per shot
Scenario A: A team records many attempts from outside the box and the flank, generating a high shots per 90 number but a low xG per shot. The diagnosis in this case often points to shot selection problems. The analytic response is to identify the types of possessions that lead to low-value attempts and to model interventions that increase entries into the danger area.
In reporting, present a scatter of shot locations and a breakdown of assist types to show whether the team is forcing speculative attempts rather than constructing high-value patterns; this immediately clarifies where coaching focus should lie Opta Analyst.
Player-level case: few high-quality attempts versus many low-quality attempts
Scenario B: A forward with low volume but high xG per shot may be a candidate for more playing time or a tactical tweak to create additional service. Conversely, a high-volume player with low xG per shot might still provide value through pressing or chance creation secondary effects, so the choice depends on the role required.
Use a small table or bar chart to compare players on shots per 90, xG per shot and non-penalty xG per 90. Annotate any penalties and recent positional changes so the audience understands context and avoids overattributing performance to finishing skill alone CIES Football Observatory.
How to present findings to coaches or nontechnical audiences
For nontechnical stakeholders, translate measures into simple trade-offs: more attempts from low-value areas versus fewer attempts in high-danger zones. Visuals that compare two clear alternatives and a short recommended action list are typically most effective.
Always include a transparency note about model inputs and limitations so coaches understand whether pressure variables or tracking data were part of the xG estimates; methodology explainers published since 2024 provide step-by-step inputs that you can reference in supporting documentation FIFA Training Centre.
Conclusion: practical checklist and next steps for analysis
Checklist: compute shots per 90, xG per shot and non-penalty xG per 90; visualize shots versus xG with rolling averages; annotate penalties and blocked attempts; document model inputs used. These steps keep analysis transparent and decision-ready; see Funded Plays for resources.
For further reading and validation resources, consult methodology guides from FIFA and Opta and practitioner reports that discuss tracking-era enhancements and the Funded Plays blog. Remember to avoid claims about guaranteed outcomes and to describe model limits when sharing results.
Shot volume counts attempts, while shot quality estimates the probability each attempt will become a goal using features like location, angle and context.
Many analysts separate penalties by using non-penalty xG so that open-play chance creation is not skewed by spot kicks.
Shot volume is most useful in large samples or systems-focused reviews where sustained attempt rates indicate tactical intent.
References
- https://www.fifatrainingcentre.com/en/game/analysis/expected-goals-xg.php
- https://theanalyst.com/na/2021/08/what-is-expected-goals-xg/
- https://football-observatory.com
- https://statsbomb.com/articles/soccer/introducing-statsbomb-360/
- https://pmc.ncbi.nlm.nih.gov/articles/PMC11524524/
- https://blogarchive.statsbomb.com/articles/soccer/upgrading-expected-goals/
- https://support.hudl.com/s/article/expected-goals?language=en_US%26topic=Statsbomb_Global_Football_Data_Glossary
- https://www.uefa.com/insideuefa/football-development/technical/technical-reports/
- https://www.fundedplays.com/challenges
- https://content.iospress.com/journals/journal-of-sports-analytics
- https://www.fundedplays.com
- https://www.fundedplays.com/blogs
- https://www.fundedplays.com/blogs/how-fundedplays-evaluations-work