
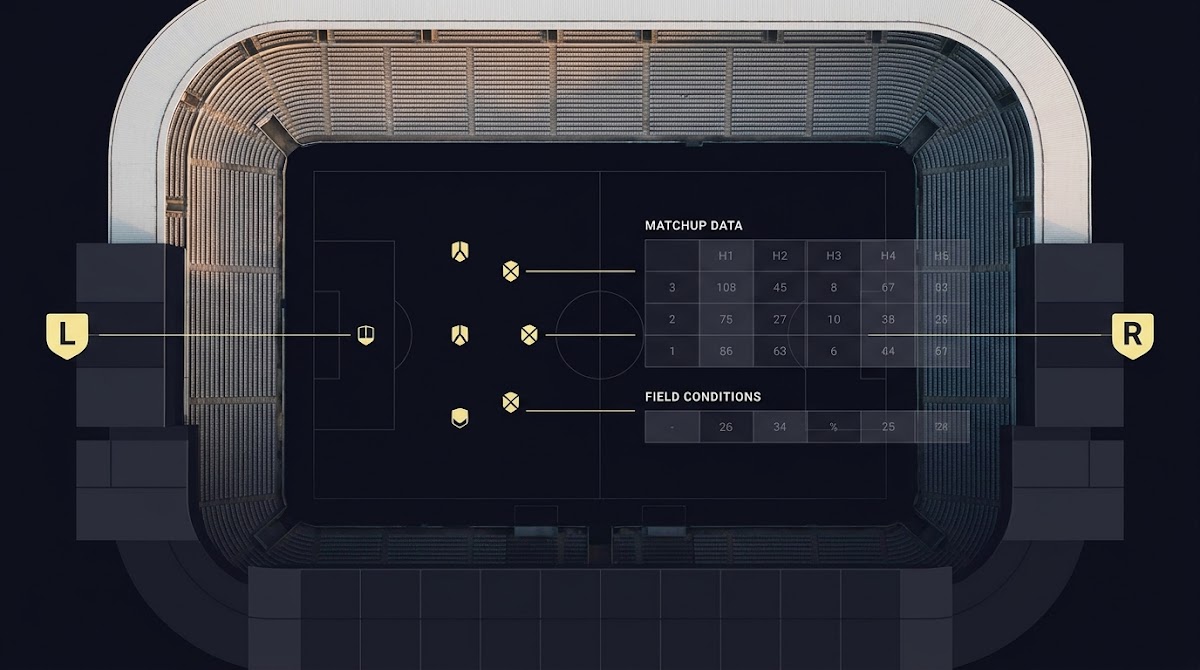
What platoon splits are and why they matter for matchups
Definition in plain terms: How Platoon Splits Affect Matchups
Platoon splits describe measurable performance differences based on handedness, for example how a left-handed hitter performs against right-handed pitchers compared to left-handed pitchers. Analysts typically express these gaps using outcome metrics such as wOBA and xwOBA, because those rates capture run impact more directly than batting average. When you measure a batter or pitcher by handedness on leaderboards you can size the expected advantage or disadvantage for a specific matchup.
Even modest platoon edges matter because baseball is a game of small margins. Over a lineup or a season, consistent small increases in expected wOBA can change run expectancy and inform better lineup construction or matchup choices. However, readers should note that most observed splits are volatile in small samples (see SABR poster) and must be treated carefully before being used to alter lineups.
To keep this practical, think of a simple example: a left-handed batter whose season wOBA vs right-handed pitching is noticeably higher than vs left-handed pitching. That difference might justify a platoon-driven start or a late-game substitution, but only after checking sample size and regression-adjusted estimates. For authoritative batter and pitcher handedness splits use leaderboards described later.
Where to get reliable handedness splits: Statcast and FanGraphs leaderboards
Which leaderboards to query (wOBA, xwOBA by vs LHP/RHP)
The primary public sources for clean handedness splits are the Statcast splits and FanGraphs splits leaderboards. Statcast provides wOBA and xwOBA by batter-versus-pitcher handedness and allows filtering by season and role, which is ideal for matchup work, while FanGraphs offers comparable splits and easy export tools for season and career intervals Baseball Savant splits leaderboard.

When you sit at a laptop to pull data, aim to extract wOBA and xwOBA by vs LHP and vs RHP for both batters and pitchers, and save the sample sizes alongside the rates. Record starter and reliever splits when available so you can treat them differently in your downstream model.
Try the first-step splits checklist
Download the splits CSVs for a small set of hitters and pitchers and follow the first-step checklist below to record rates, sample sizes and role filters.
Practical tips for pulling clean samples
Use season filters and minimum plate appearance or inning thresholds to avoid spuriously large-looking splits from tiny samples. When possible export CSVs so you can version and audit your inputs, and always keep the raw sample counts next to rate columns so every computed edge is traceable.
How to measure a platoon split correctly
Metrics to use and why (wOBA, xwOBA, run values)
Prefer wOBA and xwOBA for measuring platoon impact because they weight outcomes by run value, which aligns with decision-making goals like lineup construction and expected runs. Batting average hides walk and extra-base differentials, so it can understate or misstate a true platoon advantage when outcomes shift across types of contact (see Statcast expected statistics and a Fangraphs discussion).
Pair every raw split with its sample size. A season-to-date wOBA gap calculated on 20 plate appearances is noisy and much less reliable than the same gap measured over several hundred plate appearances. Statcast and FanGraphs leaderboards include sample counts you should carry through your calculations FanGraphs splits leaderboards.
Combine current-season splits with career and league priors using conservative shrinkage so short-term noise does not dominate your projections; update priors slowly as sample sizes grow and layer pitch-mix context before making lineup or in-game decisions.
Raw seasonal splits should almost never be used without shrinkage. Observed platoon differences stabilize slowly relative to typical sample sizes, so regression toward a league or population mean is essential to avoid overfitting to short-term noise.
A practical regression framework: stabilizing noisy splits
Why shrinkage matters
Shrinkage, or regression to a prior, guards against treating random variation as skill. When a batter shows a large wOBA gap on limited plate appearances the true talent estimate is usually somewhere between the raw split and the population mean. Using a prior pulls small-sample estimates toward that mean and produces more reliable projections over time.
Simple regress-to-prior methods analysts can use
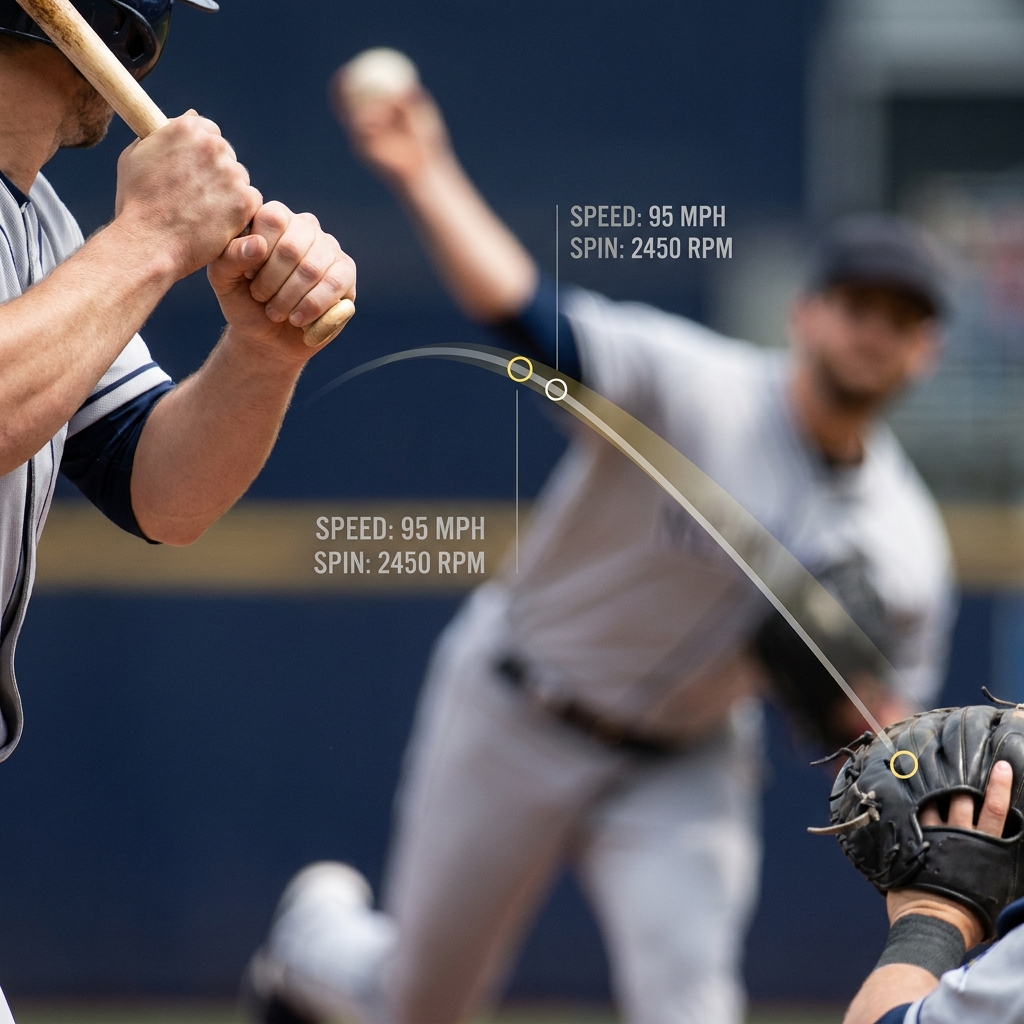
Two accessible approaches are a weighted average with a fixed prior sample size and an empirical Bayes shrinkage. The weighted average method treats the population mean as if it had N prior plate appearances and computes a combined rate; choose the prior N conservatively so small-season samples move substantially toward the mean while large samples remain close to the raw value. For more formal guidance and intuition on regressing platoon splits, see foundational how-to advice that remains relevant for practical modelers How to Regress Platoon Splits.
Apply stronger shrinkage when sample sizes are low and loosen it as sample counts grow. Keep the chosen prior documented with every run so you can revisit it as the season advances and you collect more evidence.
Why pitch mix and biomechanics matter for platoon edges
Same-handed breaking balls and glove-side movement
Raw left-right splits are incomplete because pitch type and movement change how a handedness matchup plays out. Same-handed breaking balls that move toward a batter's hands often reduce plate discipline and contact quality, which is a plausible mechanism behind many observed platoon gaps. Analysts who layer pitch-mix context on top of L/R splits get a clearer estimate of true matchup difficulty Investigating Platoon Splits.

Layering pitch-level run values onto L/R splits
Pull pitch-level run values from Statcast to adjust a regressed handedness rate. For example, a reliever whose breaking balls generate negative run values against same-handed hitters likely amplifies a same-side advantage, so your final expected wOBA edge should reflect that pitch-mix adjustment rather than relying solely on raw handedness splits.
How the three-batter minimum shapes usable platoon strategy
Why bullpen platooning is constrained
MLB Rule 5.10 enforces a three-batter minimum for pitchers, which prevents routine one-batter reliever matchups and reduces the operational value of in-inning platooning. Because of this constraint, many matchup gains are realized before the first pitch through lineup choices rather than by frequent in-inning substitutions Official Baseball Rules: 5.10.
Where lineup and pregame platooning deliver the most value
Given the reliever constraint, analysts should focus on starting lineup composition, batting order leverage and predicted reliever windows. Model opponent reliever handedness distributions to identify innings where a starting lineup advantage is likely to persist into the middle innings, and prioritize those spots for platoon-driven decisions.
A reproducible workflow: combining career-regressed splits, opponent handedness and pitch-level values
Step-by-step modeling pipeline
Step 1, gather data: pull career and current-season splits for batters and pitchers from Statcast and FanGraphs, and consult the Funded Plays blog, and keep plate appearances and innings alongside each rate.
Step 2, stabilize splits: regress season-to-date splits toward career and league priors according to your chosen shrinkage rule, document the prior sample size and record the regressed rates as a new column.
Quick regressed wOBA calculator for handedness splits
Keep Prior PA conservative
Step 3, fold in opponent context: estimate the probability of facing a starter versus reliever and the expected handedness distribution of likely relievers. Step 4, apply pitch-mix adjustments using pitch-level run values to slightly increase or decrease the regressed rate based on the opponent's pitch profile.
Step 5, compute expected edge: subtract the adjusted regressed wOBA for the pitcher from the batter's adjusted regressed wOBA to get an expected wOBA edge. Save intermediate tables for auditability and version each run so you can track how priors and adjustments change over time.
Decision criteria: when a platoon edge is actionable
Thresholds and confidence intervals to consider
Use conservative thresholds tied to your confidence in the regressed estimate. For small sample sizes, require a larger observed gap before acting because shrinkage reduces the true expected effect. Document confidence intervals or a simple confidence flag that reflects sample size and prior weight.
Contextual factors that change actionability
Consider inning leverage, batting order impact, park factors and the expected reliever handedness sequence when deciding whether to start a platoon move. A modest expected wOBA edge in a high-leverage spot or a favorable batting order position can be more actionable than the same edge in low leverage situations.
Typical mistakes and pitfalls to avoid
Overfitting small samples
Relying on raw splits from tiny plate appearance totals is a common failure mode. Without shrinkage, analysts interpret noise as skill and make lineup decisions that do not hold up. Always check sample counts before acting and prefer regressed estimates for decisions that affect multiple innings or lineup spots.
Ignoring pitch mix or reliever constraints
Another frequent mistake is treating handedness as a standalone signal without accounting for pitch types and the three-batter minimum. A pitcher with heavy same-handed breaking balls may produce different outcomes than a pitcher whose repertoire is mostly four-seam and changeups, so layer pitch-mix adjustments and relay reliever deployment probabilities when modeling usable edges.
Practical examples and scenarios: starter matchups, late-inning reliever windows and lineup platooning
Example A: starting pitcher with a clear handedness weakness
Scenario steps: pull the batter and starter raw splits from Statcast or FanGraphs, note the sample sizes, compute regressed rates using your chosen prior, and then apply a pitch-mix modifier if the starter throws a pitch type that exacerbates same-handed weakness. Work the calculations stepwise and save each intermediate value so the decision is transparent to colleagues.
In the writeup, show raw split and sample count, regressed split, pitch-mix adjustment and the final expected wOBA edge. If the regressed and adjusted edge remains meaningful under a conservative prior, consider the lineup change; otherwise opt for a conservative approach and monitor additional data.
Example B: late-inning reliever with mixed pitch mix and three-batter constraint
For late-inning decisions, first model the likely reliever sequence and handedness exposure across the expected plate appearances. Because of the three-batter minimum, a reliever who looks favorable on a single-batter matchup may not produce that matchup in practice, so weigh the probability of facing the targeted batter set and require higher confidence before subtracting a lineup spot for a one-inning advantage.
Document the reliever usage assumptions, include regressed splits for same-handed and opposite-handed outcomes, and prefer moves that work across likely multi-batter windows rather than relying on a single projected matchup.
Implementation checklist and templates for analysts
Minimal required fields for a matchup table
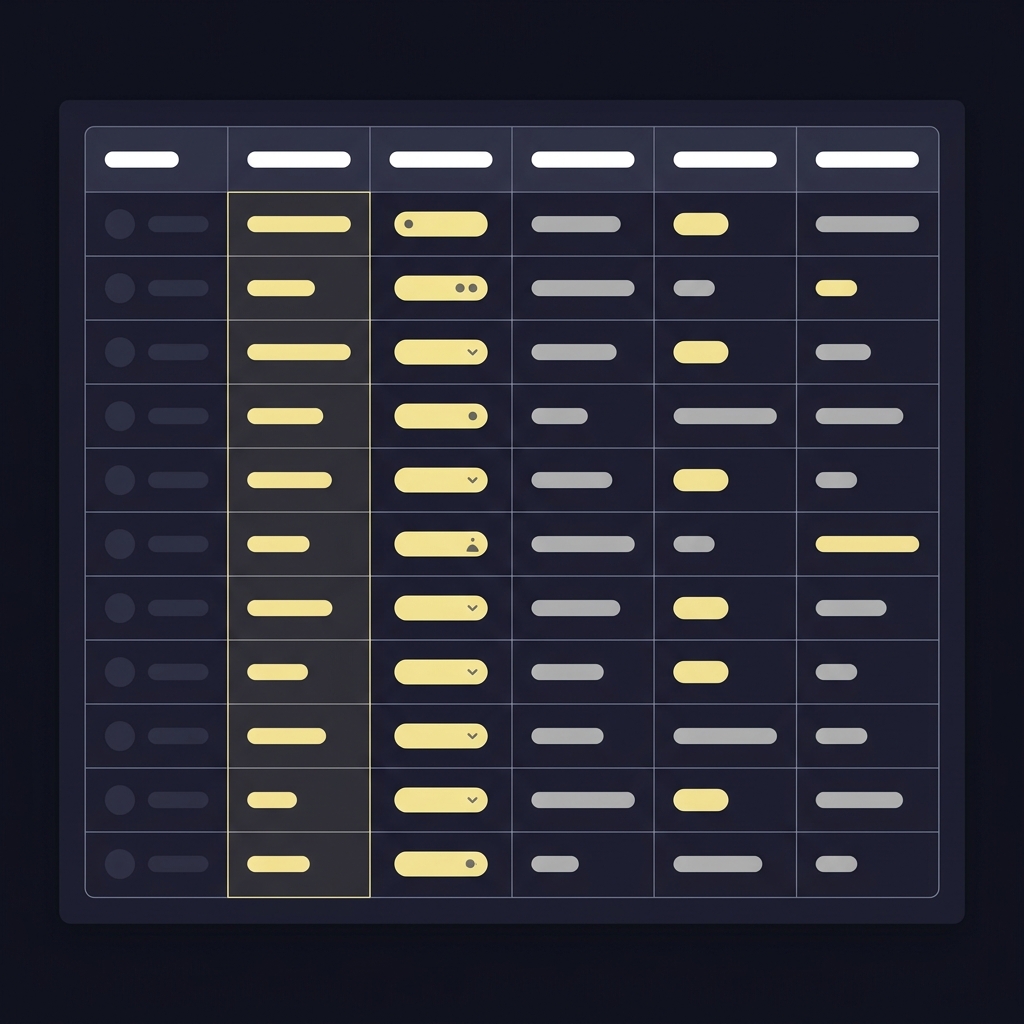
Minimal columns to collect: batter handedness, pitcher handedness, raw wOBA vs hand, sample size, regressed wOBA, pitch-mix adjustment, expected edge, confidence flag. Keep these columns in a single table for quick filtering and sorting when evaluating matchups.
How to log assumptions and update priors
Version each run and record the prior PA, the prior mean used, any pitcher usage assumptions, and the date. (see Funded Plays evaluations) Reweight priors slowly over the season as sample sizes grow and new evidence accumulates, but maintain conservative adjustments unless multiple seasons of consistent evidence justify stronger changes.
How platoon splits might change over time and open research questions
Effects of evolving pitcher usage and pitch repertoires
Pitch repertoires and reliever deployment patterns continue to evolve, and those shifts can alter the magnitude and frequency of platoon advantages. Monitor changes in the prevalence of certain breaking pitches and glove-side movement trends that could amplify or dampen handedness effects.
What to monitor season to season
Track signals such as the emergence of new pitch types, shifts in average glove-side movement on breaking balls and changing reliever deployment patterns. Update your priors with current-season evidence while maintaining conservative shrinkage so you do not overreact to year-to-year noise Investigating Platoon Splits.
Conclusion: conservative, reproducible application of platoon splits
Key takeaways
Use authoritative leaderboards, regress noisy splits toward reasonable priors, layer pitch-mix context and respect the three-batter minimum when translating measured edges into lineup or in-game decisions. Keep decisions documented and auditable so you can learn from outcomes.
Next steps for readers
Start by pulling a handful of splits from Statcast and FanGraphs, run regressed estimates for a small group of hitters, and track results while keeping priors conservative. Remember that no method guarantees outcomes and that disciplined process and careful documentation are the most reliable long-term allies. Visit the Funded Plays homepage.
A platoon split is the performance difference by handedness, for example how a left-handed hitter performs against right-handed pitching versus left-handed pitching.
Pull wOBA and xwOBA by batter-versus-pitcher handedness, record sample sizes, and export CSVs so you can regress the splits and audit inputs.
No, raw single-season splits are often noisy; regress them toward a league or career prior and consider pitch mix before acting.