
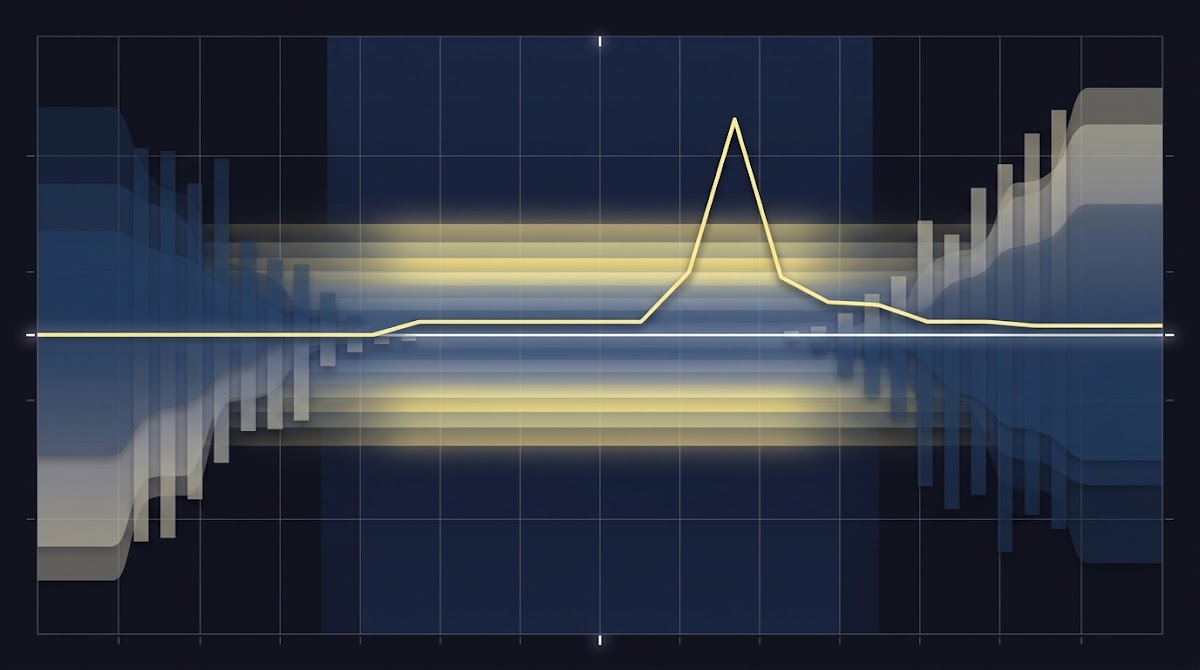
What market liquidity means and why it matters for prices
Definitions: liquidity, tightness, depth, resiliency, How Market Liquidity Can Influence Pricing
Market liquidity refers to how quickly and cheaply an asset can be converted into a trade without materially moving its price. Key dimensions include tightness, usually proxied by the bid-ask spread; depth, which describes available volume at and beyond the best quotes; resiliency, meaning how quickly prices recover after trades; and turnover, the flow of trading activity. These concepts together explain why observed transaction prices can differ from mid-market values and why execution costs vary across time and venues. For operational context, authorities and market monitors treat these metrics as core indicators of market functioning and stability, and they publish regular diagnostics to guide participants and policymakers New York Fed treasury market liquidity diagnostics.
simple monitoring spreadsheet to track spreads, depth and turnover
Update hourly during business hours
Think of liquidity like water in a channel: when the channel is full, a small paddle barely changes the flow; when it is shallow, the same paddle creates big ripples. In markets, that paddle is a trade and the ripples are immediate price moves and higher realized volatility. This analogy helps explain why the same order size can have very different execution costs depending on depth and spread, and why monitoring multiple metrics matters rather than relying on a single headline figure.
Concise definitions help translate observations into action. The bid-ask spread measures tightness and is a direct, observable cost for immediate execution. Order book depth quantifies how much volume is available at a given price level and therefore how far a trade must walk the book. Turnover captures activity and can proxy how quickly positions can be recycled. Price-impact metrics estimate how much a trade changes the mark for a given size and are the bridge between order-book structure and realized transaction prices.
Key metrics: how to measure liquidity in practice
High-frequency measures: quoted spreads and effective spreads
Teams should distinguish quoted spreads from effective spreads. The quoted bid-ask spread is the difference between best ask and best bid at a given moment and is useful for monitoring tightness. The effective spread measures the realized cost of execution relative to a reference price and helps capture hidden costs from price movement between quote and trade. For practical monitoring, compute both over short windows so alerts reflect live conditions rather than stale end-of-day snapshots.

Depth metrics should include top-of-book depth and cumulative depth across price levels. Top-of-book depth captures immediate executable volume at the best bid and ask, while cumulative depth sums available size across successive ticks and reveals how quickly a trade will move the price. Short-run price-impact coefficients can be estimated from high-frequency trade and quote data by regressing short-window returns on signed trade volume; these coefficients offer a compact read on how order size translates into mark moves, as discussed in monitoring guidance from central authorities BIS Quarterly Review on market liquidity measures. See related Federal Reserve analysis The Relationship between Market Depth and Liquidity (Federal Reserve).
Turnover measures are complementary: intra-day and short-window turnover show how much activity is available to absorb trades, and concentration metrics reveal whether turnover reflects broad participation or a few dominant players. Higher turnover with diverse participants tends to signal greater resiliency in the event of shocks, whereas concentrated turnover can be fragile even if headline volume looks healthy.
Channels: how reduced liquidity changes observed prices
Execution-cost channel: wider spreads and immediate cost
A primary channel is execution cost. When spreads widen, the price paid or received for immediate execution moves away from the mid-price, raising transaction costs for market participants. Wider quotes therefore show up directly as higher realized execution costs for takers and can alter short-term pricing and P&L calculations used by traders and valuation desks.
Pricing teams should apply documented liquidity add-ons or haircuts tied to monitored thresholds, escalate outsized events to senior risk staff, and use depth- and concentration-aware stress tests to ensure valuations remain realistic under stressed conditions.
Market-impact channel: shallow depth makes trades move prices
Another direct channel is price impact: in shallow order books, even modest orders walk up or down the book and change the prevailing mark. This effect means that observed transaction prices incorporate a liquidity premium when depth is scarce, so smaller orders can cause outsized moves and marks may be less reliable during stress. Authorities and researchers have documented how reduced depth amplifies immediate price impact, underscoring the need for impact-aware pricing practices IMF Global Financial Stability Report.
Volatility channel: realized volatility and price formation
Reduced liquidity also raises realized volatility because price formation becomes more sensitive to incoming orders and news; with little depth, normal-sized flows cause larger price swings and higher short-run variance. Studies and official reviews link low depth to increased realized volatility around macro announcements and policy shifts, making it important for pricing teams to consider liquidity conditions when interpreting short-term price moves BIS analysis of liquidity and volatility.
Recent evidence from authorities: what happened in 2024-2025
U.S. Treasury indicators and episodes of thinner depth
Monitoring by the New York Fed and the U.S. Office of Financial Research showed that U.S. Treasury liquidity was variable in 2024 and 2025, with episodes where depth appeared thinner and spreads widened during heightened rate volatility. These authority reports highlight how liquidity metrics move with funding and volatility conditions and why execution costs can spike in such episodes New York Fed Treasury market liquidity analysis. The ECB bulletin also discusses related market reactions ECB economic bulletin.

Those same monitoring efforts emphasize that variability matters: calm periods can mask episodic fragility, and a series of short-lived illiquid windows can materially affect realized transaction prices for participants who trade through those episodes. Pricing teams should therefore avoid relying solely on calm-period averages when setting marks or risk limits.
European pockets of reduced liquidity reported by ESMA and the Bank of England
European authorities also reported pockets of reduced liquidity in 2025 in both equity and bond segments amid rate uncertainty, although they judged overall market functioning to be largely orderly. These observations reinforce that reduced liquidity can appear across jurisdictions and asset classes and that localized episodes can still affect pricing and execution costs for cross-border traders ESMA trends and vulnerabilities report.
Across reports, authorities commonly link thinner depth and wider spreads to larger immediate price impacts during stress, which supports the operational focus on real-time liquidity indicators as part of model governance and risk management frameworks OFR U.S. Treasury market liquidity monitor. See related analysis in the Brookings commentary Treasury market resilience.
Monitoring and alerts: building a real-time liquidity dashboard
Which indicators to push into real-time monitoring
A practical dashboard should push high-frequency quoted spreads, effective spreads, top-of-book depth, short-window cumulative depth and a rolling price-impact estimate into a live view. These items let traders see both the immediate execution cost and how much volume is available to absorb orders. Authorities have recommended integrating such indicators into pricing and model governance workflows to avoid stale marks during stress IMF guidance on integrating liquidity indicators.
Start with short windows for alerts, for example an average over the past 5 to 30 minutes rather than daily averages, and include concentration indicators that flag when turnover is dominated by few participants. Short-window measures are more responsive to sudden deterioration that can appear during data releases or funding shocks.
Get a monitoring checklist and dashboard template for liquidity-aware pricing
Sign up to receive a monitoring checklist and a sample dashboard template that you can adapt for your team.
Simple alert rules can range from tiered thresholds to conditional actions. For example, a first-level alert might flag when quoted spreads exceed a recent median by a set multiple, a second-level alert when top-of-book depth drops below a nominal volume threshold, and an escalation when a combined score shows both spread widening and depth depletion. When alerts trigger, operational responses can include temporarily widening internal marks, applying liquidity add-ons or haircuts, throttling outbound orders, or escalating to a senior desk for manual review. (see Funded Plays homepage)
Simple alert rules and liquidity add-ons for pricing
Liquidity add-ons can be functional and transparent: apply an incremental execution cost to market marks based on the current spread and a price-impact coefficient derived from recent trade data. Haircuts on inventory or positions can be dynamic and reversible, expanding during detected stress and contracting once depth and turnover normalize. Clear documentation and governance make these adjustments auditable and defensible in front of senior risk officers and auditors.
How pricing teams should adjust models and routines
Incorporating liquidity add-ons and scenario haircuts
Operationally, teams often implement liquidity add-ons as conditional buffers added to mid-market marks when indicators cross thresholds. These can be simple conditional spreads or formulas that combine a multiple of the quoted spread with a size-dependent impact term. Tying add-ons to monitored indicators, and documenting the triggers and fallback logic, ensures consistency and prevents ad-hoc changes in live trading conditions.
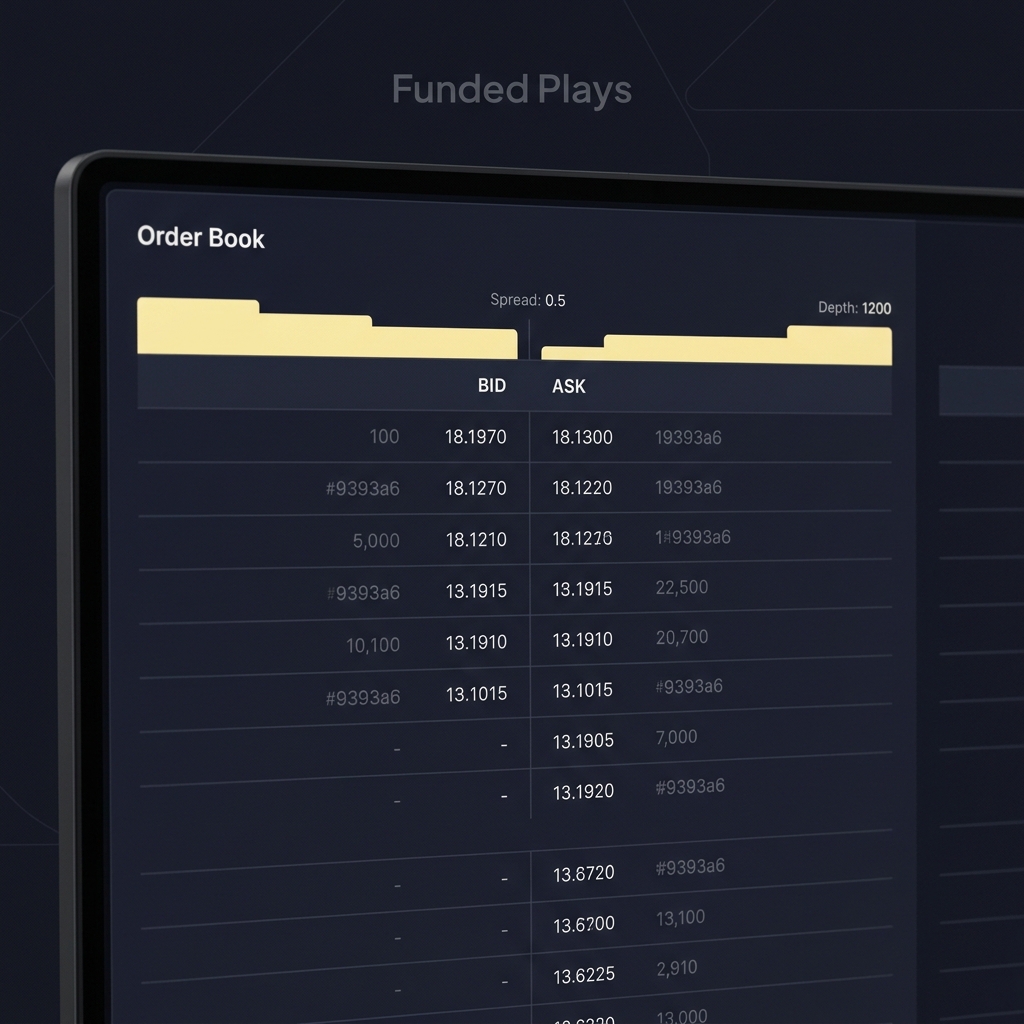
Scenario haircuts extend this idea into stress testing: rather than only shocking prices, include scenarios that reduce depth and increase spreads to see how valuations and limits behave when market microstructure deteriorates. The IMF and other authorities have suggested including liquidity dimensions in stress tests so that model governance reflects realistic execution constraints IMF on liquidity in stress testing.
Stress-testing, turnover and participant-diversity checks
Stress tests should vary spread, depth and participant concentration parameters rather than focusing solely on price paths. Turnover and participant diversity are important resiliency indicators: markets with broader participation and higher turnover generally recover depth more quickly after shocks, while concentrated turnover can leave a market brittle. Incorporate checks that simulate reduced counterparty activity and slow replenishment of the book so teams can see the combined effect on execution costs and mark reliability ESMA assessment of market resiliency.
Document the review cadence for stress scenarios and require periodic backtesting of price-impact coefficients so models remain aligned with observed behavior. This governance step helps avoid stale-impact assumptions when market structure changes.
Common errors and pitfalls when assessing liquidity
Relying solely on stale quotes or end-of-day stats
A frequent mistake is using end-of-day or infrequently sampled quotes as if they represent live execution conditions. End-of-day metrics can miss intra-day episodes of widening spreads and thinning depth that drive execution costs and realized volatility. Use high-frequency windows for monitoring and ensure that operational alerts are sensitive to short-lived but meaningful deteriorations.
Another pitfall is conflating turnover with healthy liquidity. Headline volume can be driven by a few large players or program trading, which does not guarantee resiliency if those participants withdraw during stress. Check concentration metrics alongside turnover to assess whether volume is broadly available or fragile. Authorities highlight participant diversity as a key resilience factor to consider when interpreting turnover measures BIS discussion on turnover and resilience.
Misreading concentration as healthy turnover
Concentration can mask fragility. If a small number of dealers or funds account for most trades, their withdrawal quickly removes available counterparties and depth. Practical red flags include sudden shifts in the proportion of trades attributable to the top participants and widening effective spreads despite elevated turnover. Simple checks to avoid these errors include comparing top-of-book depth to cumulative depth, monitoring the share of trading by top participants, and requiring manual review if concentration rises sharply.
Practical scenarios: narratives without invented statistics
Scenario A: a volatility spike in a shallow market
Imagine a market where top-of-book depth is thin and quoted spreads are tight under calm conditions. A surprise macro print triggers a flurry of orders. Because depth is scarce, order flow walks the book and immediate price impact is large; effective spreads widen and realized volatility increases for the short window around the print. In this scenario, the monitoring dashboard would show concurrent spread widening and depth depletion, prompting liquidity add-ons or temporary order throttles while the desk assesses the event. Authority reports from recent years document similar dynamics in fixed income and equity segments during volatility spikes New York Fed on stress episodes.
The practical response is protocol-driven: reduce aggressive posting, widen internal marks per the pre-agreed add-on schedule, and escalate to senior traders for discretionary decisions on large client flows. Clear escalation rules protect both execution quality and the integrity of internal valuations.
Scenario B: a liquidity recovery after a policy announcement
In a recovery scenario, an initial widening of spreads and a drop in turnover may be followed by a return of participants as uncertainty resolves. As diversity of participation and turnover increase, top-of-book and cumulative depth rebuild, price-impact coefficients fall, and effective spreads compress. Pricing teams can then reduce haircuts and narrow conditional spreads in stages, documenting each step. Authorities note that markets with broad participation tend to recover more quickly after shocks, which supports staged rollback of liquidity add-ons rather than immediate removal ESMA on liquidity recovery patterns.
Operationally, implement rollback rules tied to normalized indicators: e.g., sustained improvement in depth and spreads over a given window and a decline in concentration measures should trigger a stepwise reduction of add-ons until marks resume normal behavior.
Conclusion and an implementation checklist
One-page checklist for monitoring and pricing responses
Implementation checklist items include: push high-frequency quoted and effective spreads into live monitoring; track top-of-book and cumulative depth; compute short-window price-impact coefficients; monitor turnover and participant concentration; define tiered alerts; document liquidity add-ons and haircuts with clear triggers; and schedule regular backtests of impact estimates. These steps translate monitoring into repeatable operational responses and governance evidence. (also see how Funded Plays evaluations work)
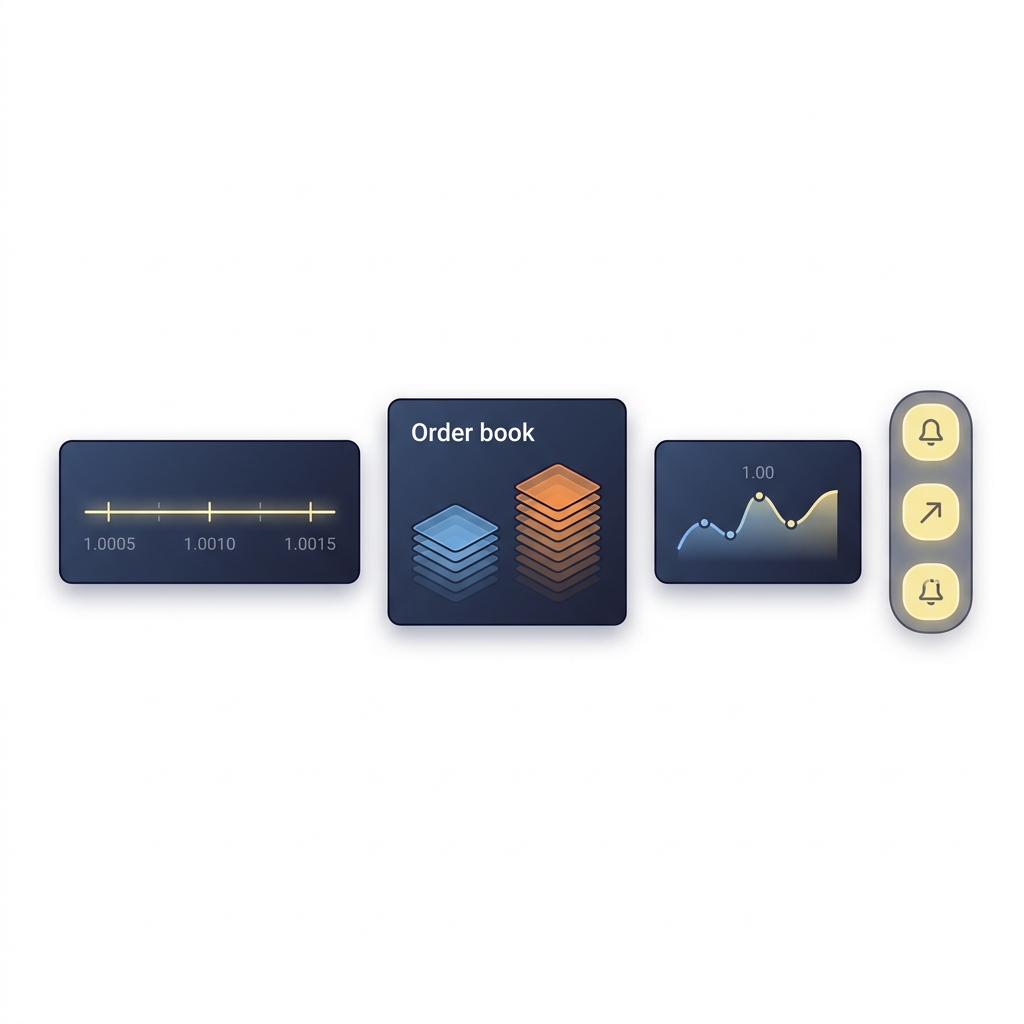
Pricing teams should also define review cadence and escalation rules: daily review of anomalies, weekly calibration of impact estimates during normal markets, and an immediate escalation path for combined spread-depth alerts that suggest stressed liquidity conditions. Authorities recommend embedding real-time liquidity checks into model governance to avoid stale marks during stress IMF on governance and liquidity monitoring.
Next steps for teams preparing for 2026 market structure
Near-term steps include instrumenting dashboards with the listed metrics, agreeing threshold rules for add-ons, building simple stress scenarios that include depth and concentration shocks, and documenting the governance path for activating and rolling back liquidity adjustments. Keep monitoring frameworks flexible because liquidity can shift quickly with policy, funding conditions and market structure changes. (read more on our blog)
A final reminder: while mechanisms linking liquidity and prices are well documented, ongoing measurement and disciplined governance are the practical defenses against surprise execution costs and unreliable marks. Make monitoring routine and ensure that changes to add-ons and haircuts are transparent, documented and subject to review.
Core metrics include quoted and effective spreads for tightness, top-of-book and cumulative depth for available volume, short-window turnover for activity, and price-impact coefficients to translate size into expected mark moves.
Teams should tie conditional add-ons or haircuts to monitored thresholds, include liquidity dimensions in stress tests, and document triggers and rollback rules within model governance.
No. Turnover must be assessed with participant concentration and depth because high volume from few participants can mask fragility if those participants withdraw during stress.
References
- https://www.newyorkfed.org/markets/treasury-market-liquidity
- https://www.bis.org/publ/qtrpdf/r_qt2409.htm
- https://www.federalreserve.gov/econres/feds/files/2025014pap.pdf
- https://www.imf.org/en/Publications/GFSR/Issues/2024/10/Global-Financial-Stability-Report-October-2024
- https://www.ecb.europa.eu/press/economic-bulletin/focus/2024/html/ecb.ebbox202308_01~352236489b.en.html
- https://www.fundedplays.com/challenges
- https://www.esma.europa.eu/press-news/esma-news/trends-risks-and-vulnerabilities-report-2025
- https://www.financialresearch.gov/treasury-market-liquidity/
- https://www.brookings.edu/articles/treasury-market-resilience-ever-more-important/
- https://www.fundedplays.com
- https://www.fundedplays.com/blogs
- https://www.fundedplays.com/blogs/how-fundedplays-evaluations-work