
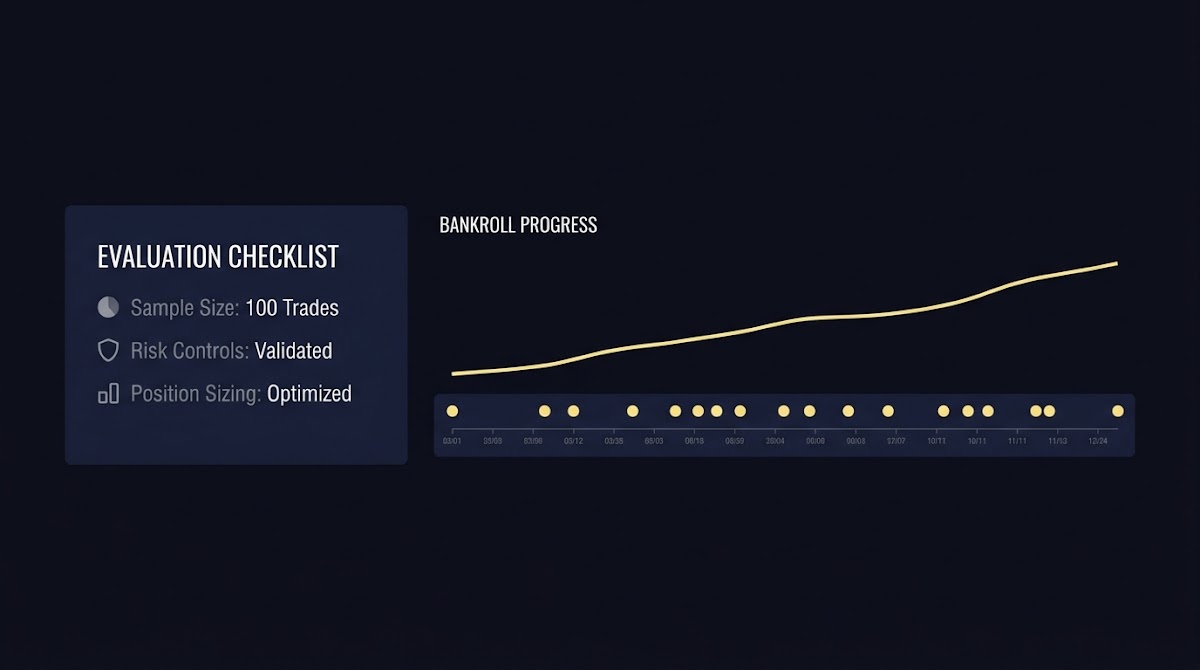
How Many Trades Should You Place During an Evaluation, definition and context
On funded-simulation platforms, an evaluation trade is a single prediction or position taken inside a structured challenge that uses a virtual bankroll to measure consistency and skill. In this context the goal is to demonstrate steady performance under the rules of the challenge rather than to place speculative bets for real money. That distinction matters because evaluation settings focus on repeatable forecasting and rule compliance, not on guarantees of future rewards.
Counting how many trades you place during an evaluation matters for two separate reasons. Statistically, the number of trades determines how precisely you can estimate your true win rate and whether an observed record is plausibly different from a reference rate. Operationally, frequency interacts with drawdown and daily-loss caps in a way that can make a technically good strategy fail an evaluation if you breach limits too often. Responsible planning treats both sides together instead of trying to maximize volume at any cost.
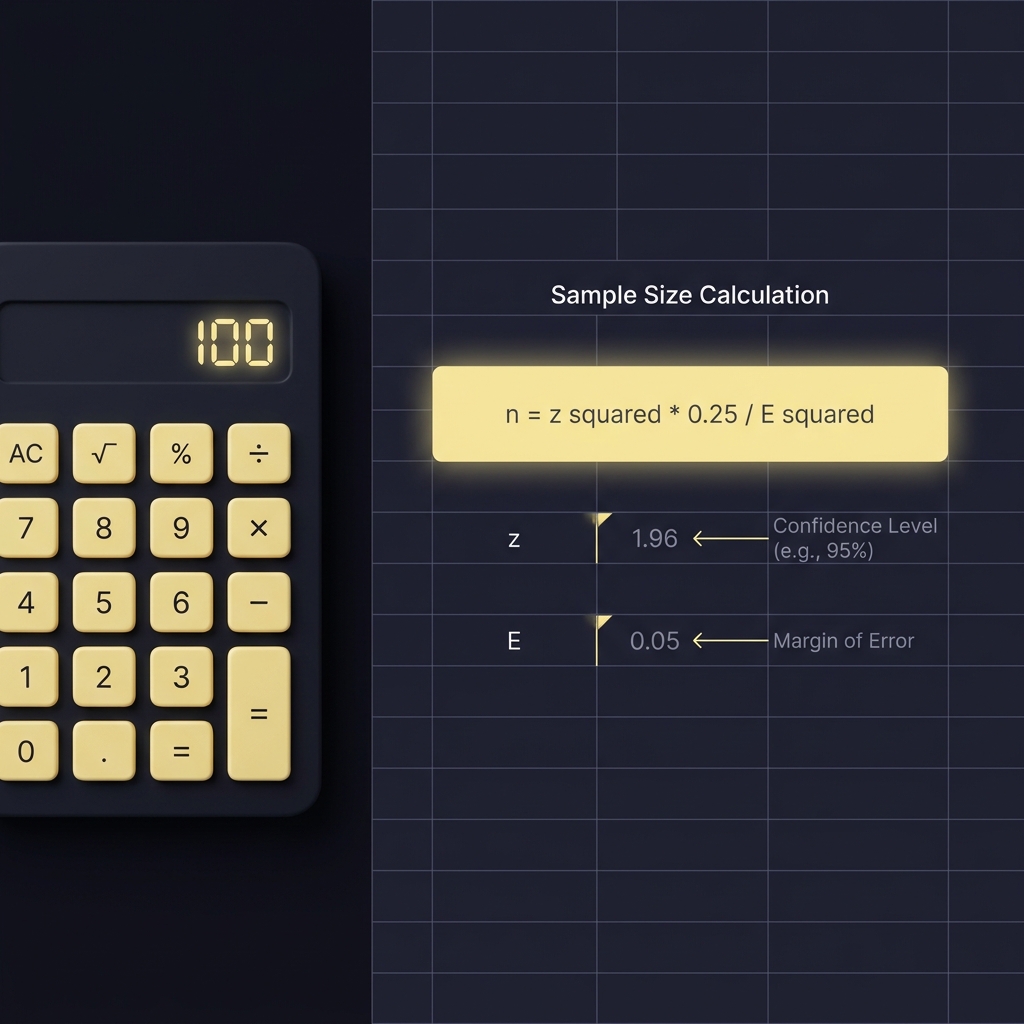
conservative sample-size calculator for binomial win rates
uses the conservative rule from OpenStax
In a Funded Plays evaluations, an individual trade counts when you submit a prediction that the platform records and scores under the challenge rules. Platform rules can control what counts as a trade, how partial fills or canceled selections are handled, and how stakes or virtual bankroll units are applied. Always check the challenge rule set for definitions that affect countable entries and compliance.
On the practical side, some external rules illustrate how frequency links to risk controls. For example, well-known day-trading regulations show how built-in limits affect high-frequency activity and why a conservative cadence is often safer when you must obey drawdown and daily-loss caps during an evaluation FINRA day trading margin requirements.
Statistical framework: estimating a win rate and minimum trades (sample-size basics)
When you do not know the true win rate in advance, a simple and conservative rule of thumb for a minimum number of trades comes from treating the outcome as a Bernoulli trial and using the maximum possible variance. The conservative formula is n = z^2·0.25/E^2, where z is the z-score for your chosen confidence level and E is the margin of error you will tolerate for the estimated win rate.
The components matter in plain language: z encodes how confident you want to be (for 95 percent confidence, z is about 1.96), and E is how close to the true rate your sample estimate should be (for example, a margin of error of 5 percentage points is E = 0.05). The 0.25 term appears because a Bernoulli variable's variance is p(1-p), which is maximized at p = 0.5 and equals 0.25; using that maximum makes the formula conservative when the true rate is unknown OpenStax Introductory Statistics.
See FundedPlays Challenges and evaluation rules
Download a simple sample-size worksheet or spreadsheet template to compute n from your chosen confidence and margin-of-error values, and use it to set a defensible minimum trade count before you start.
To make the rule usable, here is a friendly worked example. Suppose you want a 95 percent confidence interval around your measured win rate with a margin of error of plus or minus 4 percentage points. For 95 percent confidence use z ≈ 1.96 and E = 0.04; plug those into the formula and get n = 1.96^2 * 0.25 / 0.04^2, which evaluates to a minimum in the low thousands. Use the calculator or a spreadsheet to get the exact value for your chosen settings and treat it as the conservative starting point for planning trades.
The conservative sample-size rule helps you avoid misleading small-sample conclusions, but it is only a starting point. If you have prior knowledge about your likely win rate, you can refine your calculation; if not, the maximum-variance assumption keeps your estimate defensible until you gather more data. See a detailed discussion of sample size calculations for binomial proportions at PMC.

Precision checks: why use Wilson score intervals instead of the simple Wald method
Point estimates are useful, but interval estimates tell you how much uncertainty surrounds a measured win rate. The simple Wald interval, which uses a normal approximation around the sample proportion, can perform poorly when samples are small or when the observed proportion is near 0 or 1. That poor coverage means the interval may be too narrow or misplaced, giving a false sense of precision.
Practitioners prefer the Wilson score interval because it corrects the coverage issues of the Wald interval in the small-sample and extreme-probability regimes. The Wilson method adjusts the center and width of the interval in a way that yields more reliable probability coverage for realistic sample sizes, which is why it remains a recommended choice for proportion confidence checks NIST/SEMATECH Wilson score guidance. See a practical walkthrough of the Wilson score interval at Statistics Fundamentals.
Conceptually, think of the Wilson interval as borrowing a small amount of regularization that keeps the interval credible when your observed wins or losses are lopsided or when you have only a few trades. For evaluation planning that can mean the difference between a defensible pass threshold and an overstated claim based on a shaky interval.
To compare methods in practice, check your measured win rate with both the conservative sample-size rule and a Wilson interval. If the Wald and Wilson intervals are similar for your sample size and observed rate, you can be confident either is close enough. If they diverge, favor the Wilson result for decisions about pass thresholds or public claims.
When you need to prove you beat a benchmark: power analysis for one-sample proportion tests
If your objective is to show your win rate exceeds a benchmark-for example, to demonstrate you consistently beat a reference win rate-you need an a priori power analysis rather than just a precision-style margin-of-error calculation. Power analysis translates the desired effect size, significance level, and desired power into a required number of trials so you design an evaluation that has a good chance to detect the effect if it exists.
The core inputs are effect size (the difference between your expected win rate and the benchmark), alpha (the acceptable false-positive rate), and power (the probability of detecting the difference if it is real). Smaller effect sizes, lower alpha, or higher target power all increase the number of required trades. Statisticians and clinicians commonly use these concepts to set sample sizes before data collection StatPearls power and sample size.
Use a conservative sample-size rule such as n = z^2·0.25/E^2 for an initial minimum, or run a power analysis when you need to demonstrate superiority versus a benchmark; always validate with Wilson intervals and simulations and align trade cadence with drawdown and daily-loss caps.
As an illustration, if you expect your true win rate to be modestly above a benchmark, plan for a larger number of trades. Use power calculators for a one-sample proportion test to translate your chosen alpha and power into a numeric trade-count requirement. This makes your evaluation plan transparent: you state the hypothesis, the risk tolerances, and the resulting minimum trades before any outcomes are recorded.
Remember that a power-based plan differs from the conservative margin-of-error plan because it explicitly targets the ability to detect a specific improvement over a benchmark instead of merely estimating the win rate within a fixed margin. Both approaches are defensible; which to pick depends on whether you are estimating a rate or trying to prove superiority.
Aligning trade frequency with risk controls: drawdowns, daily-loss caps, and operational limits
Even if your statistical plan calls for many trades, frequency interacts with drawdown risk in ways that formulas alone do not capture. More trades increase exposure to runs of bad outcomes, and evaluation rules often include drawdown or daily-loss caps that can end or pause an account if breached. Planning trade cadence must therefore align with those operational limits rather than treat them as afterthoughts.
External rules provide useful perspective on why frequency matters operationally. Rules that limit intensive day trading under certain account conditions show how frequency, margin, and capital requirements can constrain active strategies, so a conservative cadence that respects drawdown caps is often the better path for an evaluation setting FINRA day trading margin requirements.

Funded-simulation platforms typically publish specific challenge rules that set what triggers a drawdown fail, how daily-loss limits are calculated, and how consecutive losses affect account status. Read those rules before finalizing trade cadence so your planned frequency does not create unnecessary failure modes when a streak turns against you.

Where possible, plan a cadence that balances the statistical need for sample size with operational safety. That often means stretching the evaluation window modestly or using smaller virtual stakes early so you can accumulate the required number of trades without repeatedly testing daily-loss or drawdown thresholds. See our blog for additional planning ideas.
Position sizing and behavioral pressure: using Kelly and fractional Kelly to avoid overtrading
How much you risk each trade affects both variance and the psychological pressure to change behavior mid-evaluation. Position-sizing frameworks such as the Kelly criterion connect an edge and variance to an optimal stake size, but full Kelly can be aggressive and produce large drawdowns in practice. A common pragmatic approach is fractional Kelly, which reduces volatility and the urge to overtrade when targets look at risk of slipping.
The intuition is simple: if your stake size is too large relative to your edge and variance, a few bad outcomes can create drawdowns that force you to deviate from the plan and chase recovery. Fractional Kelly accepts a smaller long-run growth rate in exchange for smoother equity dynamics, which can be especially valuable in an evaluation that penalizes drawdown breaches CFA Institute guidance on Kelly and position sizing.
When you choose position sizing for an evaluation, document the rule you will follow and use it throughout. A pre-declared fractional Kelly fraction, or a fixed-per-trade stake relative to the virtual bankroll, reduces behavioral drift and makes post-hoc review of your plan easier to justify.
Testing your plan: backtesting, Monte Carlo and out-of-sample validation
Analytic formulas give a starting plan, but realistic simulations reveal whether that plan survives the random streaks and drawdowns you will face. Backtesting with an out-of-sample holdout or Monte Carlo bootstrapping helps estimate expected time-to-target, typical and worst-case drawdowns, and the probability of passing the evaluation under your planned cadence and size rules.
In particular, simulate many runs using your intended stake sizing, the expected underlying win probability you think is realistic, and the evaluation's drawdown and daily-loss constraints. These runs will show the distribution of outcomes and highlight how often you might fail for operational reasons even when your average win rate is adequate CFA Institute position-sizing and simulation guidance.
A practical simulation check to add to your plan is a summary table reporting median time-to-target, the 90th-percentile time-to-target, and the worst observed drawdown across simulated runs. If the worst-case drawdown with your stake sizing regularly breaches evaluation limits, either reduce per-trade size or lengthen the evaluation window until simulations show acceptable performance.
Use spreadsheets or simple scripts to run Monte Carlo experiments if you do not have access to advanced tooling. The goal is not to predict a single run but to understand the range of plausible outcomes so you can pick a trade count that is both statistically defensible and operationally feasible.
Decision checklist and practical rules for choosing your trade count
Combine statistical and operational checks into a compact decision checklist you can apply before starting. Items should include the statistical basis you chose, your precision or power targets, the interval method for checking results, position-sizing rules, drawdown and daily-loss caps, and the validation simulations you will run.
Ground each checklist item in a clear assumption: state your expected win rate, the margin of error or effect size you care about, your chosen alpha and power if doing hypothesis testing, the interval method (Wilson recommended), and your stake-sizing rule. Writing these assumptions down makes the plan auditable and reduces the temptation to change parameters mid-evaluation OpenStax Introductory Statistics.
Here is a short action list you can copy into a planning doc: choose conservative minimum trades or run a power analysis, pick Wilson for interval checks, set a fractional Kelly or fixed-stake rule, identify drawdown and daily-loss caps, and simulate to confirm that cadence is likely to survive typical streaks.
Common mistakes, stalls, and how to recover
Some common errors produce invalid or frustrating evaluations. People often rely on very small sample sizes without checking coverage, which can lead to overconfident statements about skill. Others overfit by tuning strategy in-sample and then expecting those in-sample numbers to hold up under evaluation conditions. Ignoring drawdown rules or increasing stake sizes after a few losses are also frequent mistakes.
If you recognize these problems in mid-evaluation, pause and run a quick validation. Use a Wilson check to assess interval coverage for your current record, simulate forward under your declared stake-sizing rule to see whether reaching your target is still plausible, and consider widening your evaluation window instead of increasing stake sizes. These steps help recover defensible footing without chasing losses NIST/SEMATECH guidance on Wilson intervals.
When behavioral pressure is the main issue, decrease per-trade risk using fractional Kelly or a fixed-per-trade rule and re-run simulations. That trade reduces volatility and can restore the discipline needed to complete the planned number of trades without repeated drawdown breaches CFA Institute on controlling drawdown with sizing.
Final checklist and next steps
To finish your plan, pick one of the two statistical approaches: a conservative sample-size calculation for estimating your win rate with a given margin of error, or a power analysis if your goal is to demonstrate superiority over a benchmark. Use Wilson intervals for precision checks, validate the cadence with Monte Carlo or out-of-sample simulations, and align frequency with drawdown and daily-loss caps and your chosen position-sizing rule.
Document all assumptions before starting: expected win rate, margin of error or effect size, alpha and power if applicable, interval method, stake-sizing rule, and the simulations you will run. Prioritize consistent, disciplined execution over forcing a high trade count; a defensible plan executed calmly is preferable to an over-ambitious plan that breaks operational rules.
Start with the conservative sample-size formula n = z^2·0.25/E^2 using your chosen confidence level and margin of error, or run a power analysis if you need to prove superiority versus a benchmark.
Use the Wilson score interval for more reliable coverage, especially with small samples or proportions near 0 or 1.
Pause to validate with simulation, reduce per-trade risk using fractional Kelly or fixed stakes, and consider lengthening the evaluation window rather than increasing stake sizes.
References
- https://www.fundedplays.com/blogs/how-fundedplays-evaluations-work
- https://www.finra.org/investors/insights/day-trading-margin-requirements-know-rules
- https://openstax.org/books/introductory-statistics-2e/pages/8-3-confidence-intervals-for-a-population-proportion
- https://pmc.ncbi.nlm.nih.gov/articles/PMC4792103/
- https://www.itl.nist.gov/div898/handbook/prc/section2/prc241.htm
- https://www.ncbi.nlm.nih.gov/books/NBK574428/
- https://www.fundedplays.com/challenges
- https://www.fundedplays.com
- https://www.fundedplays.com/blogs
- https://statisticsfundamentals.com/confidence-intervals/wilson-score-interval/
- https://www.cfainstitute.org/en/research/enterprising-investor/kelly-criterion-position-sizing