
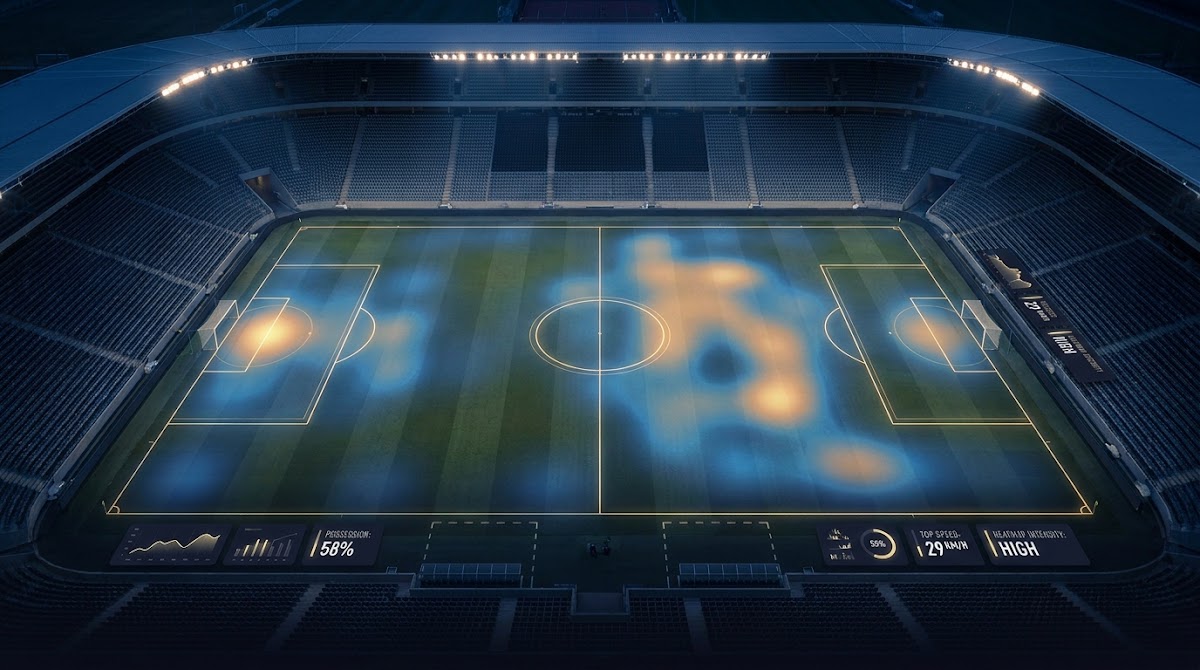
What live game data is and why it matters
Definitions: tracking, sensors, events, How Live Game Data Supports Better Decisions
Live game data refers to the streams of positional coordinates, sensor readings, and logged events produced during a match, processed quickly enough to influence decisions in real time. At a basic level, this includes optical tracking that follows players and the ball, embedded sensors that record high-frequency motion of bats or balls, and event logging which annotates incidents such as passes, shots, or substitutions. These streams are the raw inputs that, once cleaned and interpreted, become the signals teams and product teams use to act faster and with more information.
Different roles use live game data in distinct ways. Coaches and analysts use positional and phase-of-play tags to adjust tactics and substitution plans, broadcasters use live stats to shape narratives and visuals for viewers, product teams convert telemetry into fan-facing KPIs and features, and integrity teams monitor unusual patterns that could indicate manipulation. For example, tournament technical reports show how positional tracking and event tagging feed tactical review and substitution planning, helping practitioners frame immediate priorities after a match UEFA EURO 2024 technical report.
simple latency monitor to flag out-of-budget feeds
run every minute
Understanding the sources, and who relies on them, sets expectations about timing and reliability. For coaching, positional continuity and phase recognition matter more than microsecond timing. For broadcast, sub-second latency combined with clear definitions of metrics is critical. For product engineering, throughput, scalability, and public presentation of telemetry are front of mind. Framing those needs early reduces misaligned implementation choices.
How data is captured: hardware and source tradeoffs
Multi-camera optical systems versus broadcast-derived tracking
There are two common ways to get positional data across large play areas. Multi-camera optical setups use multiple calibrated cameras and computer vision to track players and the ball directly, producing high-accuracy, high-sampling outputs where infrastructure and calibration are possible. An alternative is broadcast-derived tracking which reuses camera feeds intended for television and applies algorithms to extract positions, a lower-cost and more scalable option in many settings. Recent peer-reviewed work finds that broadcast-derived tracking can be a valid, scalable alternative for certain soccer analyses, provided teams account for known error characteristics broadcast-derived player and ball tracking in soccer: a validity assessment.

Each approach carries tradeoffs. Multi-camera systems generally yield lower position error and more consistent sampling rates, but they are expensive to install and maintain. Broadcast-derived feeds reduce setup complexity and can reuse existing production cameras, but they often have higher and variable error bounds. The practical implication is that downstream metrics and decision rules must reflect those error patterns, and teams should avoid treating outputs as if they came from identical systems.
Embedded sensors, whether in the ball, bat, or athlete equipment, produce high-frequency telemetry that is particularly useful for KPI construction tied to specific actions. Recent public telemetry rollouts show how bat-tracking metrics were converted into clear, fan-facing KPIs that analysts and product teams could use directly Introducing bat tracking: New Statcast metrics on Baseball Savant.

From a systems perspective, sensor feeds tend to have predictable sampling behavior but can require additional steps for synchronization and calibration, especially when combined with optical systems. When planning capture, teams should weigh cost, scalability, and the acceptable magnitude of position or timing error for their intended decisions.
Streaming pipelines: ingestion, cloud compute, and latency
From on-field feed to cloud: ingestion and transformation
A typical streaming pipeline begins at capture, then moves through ingestion, cleaning, inference, and distribution. Ingestion packages raw packets into ordered streams, cleaning removes or flags obvious anomalies, inference maps raw positions into derived events or metrics, and distribution delivers standardized feeds to dashboards, broadcasts, or archive systems. Each step adds processing time, so teams should budget a latency allowance that matches the most time-sensitive consumer of the data.
Managed cloud streaming combined with real-time inference is now a practical approach for many organizations, as demonstrated by cloud-to-thing implementations that reduce end-to-end delay. Documented implementations show how leagues and production teams use cloud services to ingest and compute stats quickly enough for live broadcast needs, demonstrating that a well-designed pipeline can meet strict time constraints NFL’s Next Gen Stats on AWS.
Real-time inference performs tasks such as recognizing a phase of play, counting pressing sequences, or computing a live KPI from sensor bursts. Broadcast and on-air use impose tight service level objectives because show segments expect metrics within seconds. A common bottleneck is clock alignment across systems, for example when sensor timestamps drift relative to video frames, causing temporary metric misalignment and the need for reconciliation before trusted display. See further discussion on why real-time sports data matters.
To reduce risk, teams separate the pipeline into fast, best-effort outputs for live display and slower, reconciled versions for records and coaching analysis. That separation protects immediate needs while preserving accuracy for later review, and it makes clear to end users which version they are viewing.
Translating telemetry into usable metrics and dashboards
Designing role-specific KPIs
Raw positions and sensor readings are rarely useful by themselves, so product teams and analysts design KPIs that capture actionable patterns. For example, a bat-tracking feed can be summarized into strike-zone exit velocity or sweet-spot percentage, metrics that are legible to fans and useful to analysts Introducing bat tracking: New Statcast metrics on Baseball Savant. For coaches, KPIs often emphasize space control, pressing intensity, or phase transitions rather than single-event numbers.
Good KPI design starts with the user's question and works backward to the measurements needed, including how to handle missing or noisy data. Dashboards should present role-specific views so each user sees the right aggregation and the expected error margins for those numbers.

Dashboards must include clear metric definitions, latency indicators, and accuracy disclaimers. Users decide differently when they know a metric is a fast estimate versus a reconciled number. Displaying confidence bands, recent sample counts, and a short note on how the metric is computed helps reduce misinterpretation and establishes sensible guardrails for action.
Designers should also include simple change-history or version tags so that when a metric definition or reconciliation method changes, users can trace prior values and understand shifts that are methodological rather than performance-related.
A simple decision framework for live match-day choices
Signal quality, timing, and decision weight
Making quicker, consistent choices requires a simple framework that teams can apply under pressure. A practical three-step approach is: check data quality, estimate latency and confidence, then map the signal to decision urgency. This keeps in-play choices proportionate to the strength of the evidence and the time available to act.
For example, a positional pattern identified through phase-of-play tagging might suggest a substitution if it persists for multiple phases and the position error is within acceptable bounds. The UEFA report illustrates how phase tagging and positional clusters support substitution and tactical planning, when used as part of a structured review UEFA EURO 2024 technical report.
By combining validated capture methods, a managed streaming pipeline with a clear latency budget, role-specific KPIs, and layered QA that separates fast estimates from reconciled records, teams can act on timely signals while understanding their limitations.
When running this framework during a match, assign decision weight beforehand. High-weight choices should require stronger evidence and lower latency uncertainty before execution, while low-weight adjustments can tolerate faster, less reconciled inputs.
Example workflows for substitution and tactical adjustment
A concrete workflow might look like this: the analyst flags a repeating pressing pattern, the coach reviews a two-phase clip plus the KPI trend for the last 10 minutes, the operations lead confirms timestamp alignment and acceptable error bounds, then the coach decides whether to substitute or adjust tactics. Embedding these steps in a practiced routine reduces the chance of overreacting to a single noisy observation.
Rules of thumb help. If a metric is based on broadcast-derived positions with higher known variance, look for supporting evidence from a second stream or wait for a reconciled check before making a high-cost substitution. If a sensor-derived KPI shows a mechanical issue, a faster intervention may be justified because the signal typically has higher fidelity.
Practical use cases: coaching, broadcast, and product teams
Tactical reviews and training priorities
Coaches use positional data and pressing pattern analysis to set halftime and training priorities. For instance, repeated loss of midfield control identified via phase-of-play tags can indicate a need to adjust personnel or training focus. Tournament reports provide examples of how positional tracking informed specific tactical adjustments and training emphasis after matches UEFA EURO 2024 technical report.
In training, live feeds let staff test small tactical changes and see immediate effects on spatial control metrics. Using live metrics in practice accelerates learning cycles, provided coaches understand the measurement limits and practice with the same data definitions used in matches.
Enhancing broadcast narrative and fan telemetry
Broadcasters use real-time stats to build viewer narratives and support visuals. Teams that can supply clear, validated KPIs improve the viewer experience by having consistent definitions and short explanations ready for on-air use. Production teams also rely on cloud streaming and low-latency inference to meet segment timing constraints while keeping stats meaningful NFL’s Next Gen Stats on AWS.
Product teams translate telemetry into fan features, such as a bat-tracking KPI on a stats page, letting fans explore otherwise hidden aspects of play. Those productized KPIs are most useful when the telemetry is presented with intuitive labels and short notes about sampling or expected variance.
Marker placement: integrity, monitoring, and regulatory context
Why monitoring and anomaly detection matter
Integrity teams and regulators pay close attention to live feeds because in-play markets and live competitions depend on timely, trustworthy data. Recent regulatory reporting highlights the ongoing relationship between in-play activity and requirements for low-latency, governed feeds, which shapes expectations for operators and data providers Gambling participation in 2024: In-year update.
Download the live data QA checklist for challenge operators and teams
If you manage live feeds, keep a concise QA checklist and a named escalation path for anomalies to preserve fair markets and informed decision making.
Integrity monitoring continues to detect suspicious matches and patterns, underscoring the need for anomaly surveillance layered on top of basic QA. Reports on match integrity indicate that continued vigilance, together with robust access controls and audit logs, is essential for preserving trust in live products Sportradar Integrity Services: 2025 Betting Corruption and Match-Fixing Report.
For in-play markets, small differences in latency between providers can create unfair advantages, so governance must include latency budgets, symmetric distribution rules, and reconciliation processes. Practical controls include access logging, role-based distribution, and post-event reconciliations so market participants and integrity teams can review discrepancies if issues arise.
Operational policies should be explicit about who can view what version of a feed and how to escalate suspected anomalies, ideally with predefined scripts for rapid assessment during an event.
Quality assurance: reconciling feeds and handling discrepancies
QA should combine automated detection with human review. Automated checks can surface missing samples, impossible speeds or accelerations, and timestamp discontinuities. Human reviewers focus on patterns flagged by automation, contextual video, and cross-reference checks against alternate sources to decide whether to accept, flag, or correct a metric.
A good pipeline marks fast, tentative metrics as provisional and then reconciles them with fuller data that passes human validation. This two-tier approach satisfies the need for speed while preserving later accuracy for coaching and archival uses.
Reconciliation between feeds requires consistent versioning so consumers can identify which release of a metric they are viewing. Workflows typically include an initial live publish, an automated reconciliation run that corrects obvious alignment and sampling issues, and a final validated version for records. Storing metadata such as processing timestamps and the reconciliation pass number lets teams trace how a value evolved.
Dashboards should show which version is displayed and provide a short explanation of why values might change between live and reconciled views. That transparency reduces confusion and supports better decision interpretation.
Evaluating feed accuracy: what to look for before trusting a stream
Key validation metrics
Before adopting a feed, check position error, sampling rate consistency, and timestamp alignment. Position error quantifies typical deviation from a reference, sampling rate determines temporal resolution, and timestamp consistency ensures events can be matched across sources. These basic measures reveal whether a feed meets the needs of your intended KPIs.
Where broadcast-derived tracking is used, validation studies show it can be a cost-effective alternative but teams should quantify the error bounds relevant to their use case and not assume equivalence to multi-camera systems broadcast-derived player and ball tracking in soccer: a validity assessment.
Practical tests teams can run
Simple tests include syncing a short clip with ground-truth labels, measuring mean position error across several play phases, and checking timestamp drift over time. Run tests across representative match periods rather than single snapshots, and log results so you can compare providers or runs objectively.
Always include a minimum sample size, for example multiple possessions or set pieces, so results reflect operational variability rather than isolated conditions.
Common mistakes and pitfalls to avoid
Overreacting to noisy signals
One frequent error is acting on a single noisy observation. Metrics based on small samples or feeds with known higher variance are poor bases for irreversible choices, such as a high-cost substitution. Instead, use rules that require corroboration or persistence across phases before escalating an action.
Ignoring data provenance and the feed's error profile leads to misapplied confidence in numbers. Teams that document provenance and expected error patterns are better positioned to judge whether a live signal merits immediate response.
Ignoring latency and governance
Another pitfall is treating all live feeds as equally current and authoritative. Latency differences and uneven access controls can create unfair or risky decision environments. Governance measures, such as symmetric access and clear escalation paths, reduce these risks and protect both operational integrity and regulatory compliance Sportradar Integrity Services: 2025 Betting Corruption and Match-Fixing Report.
Mitigations include setting conservative default trust levels for new feeds, mandating secondary checks for high-impact actions, and rehearsing anomaly responses during quiet periods.
A practical implementation checklist for teams and product owners
Minimum pipeline and dashboard requirements
Start with a clear latency budget for ingestion and initial inference, automated QA checks for obvious anomalies, a reconciliation pass and versioning, and dashboards that show metric definitions and confidence indicators. Those elements form the baseline needed to support live decisioning without exposing teams to unnecessary risks.
Operationally, define owners for each stage, a documented escalation path for anomalies, and simple pilot tests that exercise the full pipeline end-to-end before wider release. Vendor evaluation should include a validation report and sample data runs under representative conditions NFL’s Next Gen Stats on AWS. For practical examples, see the Funded Plays blog.
Operational roles and escalation paths
Assign clear roles: a data operations lead to monitor ingestion and QA, an analyst to translate signals into recommended actions, a coach or decision owner to weigh the advice, and an integrity officer to review anomalies and control distribution. Establish SLAs for each role and train teams on the three-step decision framework so responses are consistent across events.
Pilot tests should include simulated anomalies to verify that the escalation path works under pressure and that reconciliation and audit logs capture the needed evidence for post-event review. See details on how Funded Plays evaluations work.
Case studies and short examples
UEFA technical takeaways for tactical review
The UEFA technical report from EURO 2024 highlights how positional tracking and phase-of-play tagging helped technical observers identify consistent tactical patterns, which then informed coaching debriefs and substitution reasoning. Those examples show the practical use of positional KPIs when they are paired with clear definitions and post-match reconciliation UEFA EURO 2024 technical report.
MLB bat-tracking productization example
MLB’s bat-tracking rollout demonstrates turning high-frequency sensor telemetry into simple, public KPIs that fans, broadcasters, and analysts can use. The rollout shows the importance of clear metric labels and of communicating assumptions so users know how to interpret values in context Introducing bat tracking: New Statcast metrics on Baseball Savant.
Broadcast-derived tracking validation note
Academic validation work in 2024 found broadcast-derived tracking to be a viable, more scalable alternative to expensive multi-camera systems for certain soccer use cases, provided teams account for error bounds in their KPIs and decision thresholds broadcast-derived player and ball tracking in soccer: a validity assessment.
Conclusion: practical next steps and limits to expect
Short roadmap for adoption
Three practical next steps are: assess your decision needs and latency tolerance, run a focused pilot with representative data, and operationalize QA and governance with clear owners and reconciliation routines. These steps help teams avoid common pitfalls and build trust in live signals before scaling.
Keep in mind that standards for accuracy disclosures and latency harmonization across providers remain open questions. Teams should be conservative when comparing feeds and explicit about metric versions and expected error margins Sportradar Integrity Services: 2025 Betting Corruption and Match-Fixing Report.
Used carefully, live sports telemetry can shorten feedback loops, surface tactical signals sooner, and create engaging fan products. The key is to combine reliable capture, managed streaming, clear KPI design, and disciplined QA so decisions reflect strengths and limits of the underlying data.
For additional context, see Funded Plays.
Broadcast-derived tracking can be a valid alternative for certain analyses, but it typically has larger error bounds than multi-camera systems so validation against your use case is necessary.
A minimum pipeline includes reliable ingestion with a latency budget, automated QA checks, an initial inference layer for fast metrics, and a reconciliation pass with versioned outputs.
Teams should follow a documented escalation path, pause high-impact actions until confirmation if needed, and record audit logs so post-event review can determine root causes.
References
- https://www.uefa.com/insideuefa/football-development/technical/technical-observer-reports/uefa-euro-2024-technical-report/
- https://link.springer.com/article/10.1007/s12283-024-00426-7
- https://www.mlb.com/news/bat-tracking-statcast-baseball-savant
- https://aws.amazon.com/solutions/case-studies/nfl-next-gen-stats/
- https://www.gamblingcommission.gov.uk/statistics-and-research/publication/gambling-participation-in-2024-in-year-update-january-to-december-2024
- https://www.globenewswire.com/news-release/2026/02/10/xxxxx/Sportradar-Integrity-Services-2025-Betting-Corruption-and-Match-Fixing-Report.html
- https://medium.com/@marketing_25315/how-to-architect-a-scalable-low-latency-sports-data-pipeline-for-real-time-apps-385b18246fd8
- https://pmc.ncbi.nlm.nih.gov/articles/PMC11888854/
- https://www.lsports.eu/blog/why-sports-data/
- https://www.fundedplays.com
- https://www.fundedplays.com/blogs
- https://www.fundedplays.com/blogs/how-fundedplays-evaluations-work