

What home advantage means and why it matters
Definition and common metrics
Home advantage is the systematic difference in team outcomes when playing at home versus away. Analysts usually express it with two complementary metrics: home win percentage and home-minus-away scoring margin. For team-level splits and season summaries, these measures are straightforward to compute and allow cross-team aggregation when properly standardized across sports, with the season pages listed below as primary inputs Basketball-Reference season page. See the Wikipedia entry on home advantage for an overview.
Normalize metrics by sport, compute team-level home-minus-away measures from trusted season summaries, and aggregate with transparent weighting while controlling for schedule and officiating contexts.
Why league-level comparisons are useful
Comparing home advantage at the league level helps separate sport-wide patterns from team idiosyncrasies and supports strategy testing, scheduling analysis, and forecasting model adjustments. League-level aggregates come from team home/away splits in trusted season summaries, which let analysts examine both central tendencies and dispersion across teams Baseball-Reference season page. For a discussion of common misconceptions and empirical patterns see this analysis Home Field Advantage: The Facts and the Fiction.
Because sports use different scoring and competition structures, it is essential to treat metrics as sport-specific. For example, wins or points are the natural primary metrics in basketball and baseball contexts, while goal or run differentials are the correct measures in soccer and hockey comparisons. That sport-specific normalization keeps cross-league comparisons meaningful and avoids mixing incompatible measurement systems FBref Premier League stats.

Key findings from recent season datasets
What the 2023-24 and 2024 season summaries show
The most recent completed seasons for each league demonstrate persistent home-versus-away differences: NBA 2023-24, MLB 2024, NHL 2023-24 and Premier League 2023-24 provide team-level home/away splits that can be aggregated to quantify league-level home advantage Hockey-Reference season page.
Consistent patterns across sports
Across these seasons analysts can observe measurable home advantages, but the magnitude and the appropriate metric differ by sport. Using season summaries as the data source ensures comparability and reproducibility when analysts normalize measures by sport Basketball-Reference season page.
How to measure home advantage: metrics and standardization
Selecting comparable metrics by sport
Start by deciding the primary metric that reflects match outcomes in the sport you analyze. For basketball and baseball, wins and points or run totals are primary; for hockey and soccer, goal differentials and goals scored are the direct scoring measures. This choice drives later normalization and ensures you do not compare an apples-to-oranges pair of statistics when aggregating at league level FBref Premier League stats.
Practical steps to compute home-minus-away measures
Follow a simple step-by-step protocol: extract team-level home and away records from trusted season summaries, compute home win percentage as home wins divided by home games, and compute home-minus-away scoring margin as the difference between average home scoring output and average away output for each team. Aggregate those team-level metrics to the league level using a chosen weighting scheme (see following section for weighting choices) Baseball-Reference season page.
Choose the timeframe for your comparison carefully. Single-season snapshots are informative but can be noisy for some teams. Multi-season averages reduce variance but can muddle recent rule or schedule changes; always report sample size, period, and any selection filters used.
quick data-slicing workflow for home-minus-away metrics
run this checklist per season before aggregation
Data pipeline: aggregating season summaries to league-level
Data sources and extraction tips
Authoritative season pages are the primary inputs: Basketball-Reference for the NBA, Baseball-Reference for MLB, Hockey-Reference for the NHL, and FBref for the Premier League. These pages provide team-level home and away splits that can be exported or scraped for reproducible pipelines Basketball-Reference season page.
Handling schedules and sample sizes
Decide on a weighting method when aggregating teams to league-level metrics. Equal-team weighting treats each franchise as one observation; games-weighted aggregation weights by the number of home games and can account for imbalanced schedules. Both methods are valid; reporting both offers transparency and robustness checks Baseball-Reference season page.
When schedules change mid-season or when rule modifications occur, document the change and consider splitting your aggregation before and after the event. For small samples, highlight uncertainty and prefer multi-season estimates for stability where appropriate Hockey-Reference season page.
League-by-league headline comparisons
Topline league contrasts
A compact presentation should show, for each league: the primary metric used, the league-level home win percentage or home-minus-away scoring margin, and a directional summary of the home advantage. Build this table from the season pages so readers can reproduce the numbers directly from the cited pages FBref Premier League stats.
Get the reproducible league comparison table
Download the suggested compact comparison table and use it as a reproducible starting point for your league-level home advantage analysis.
Quick reference table suggestion (writer note)
Recommended columns: League, Season, Metric Type, League Home Win Pct or Home-Minus-Away, Aggregation Method. Produce separate rows when you report games-weighted versus team-weighted values so readers can see how weighting alters the conclusion Basketball-Reference season page. See our blog overview for related posts.
NBA: interpreting home advantage in a points-and-wins environment
Which NBA metrics matter
In the NBA use home win percentage and points margin at home minus points margin away as the primary measures. Basketball-Reference provides the team splits needed to compute these values and to construct opponent-adjusted analyses if required Basketball-Reference season page.
How scheduling (back-to-backs) influences the numbers
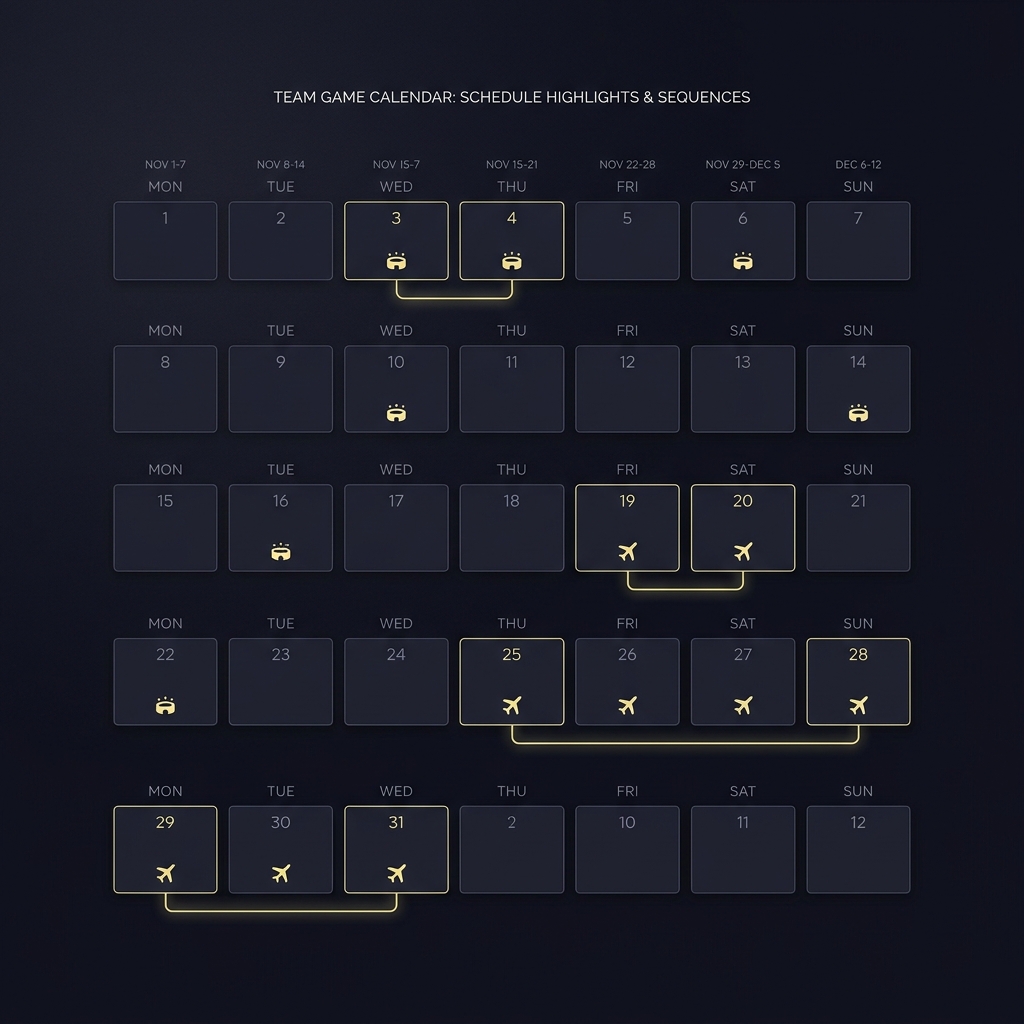
Back-to-back games, travel sequencing, and uneven rest days influence team performance and can exaggerate or dampen observed home advantage. Analysts should slice NBA home-away splits by rest categories and by whether a team traveled the previous day to see schedule-conditioned effects Basketball-Reference season page.
MLB: travel, circadian disruption, and run-based comparisons
Why MLB travel patterns are a useful case study
MLB's long seasonal schedule and frequent cross-time-zone travel make it a clear case where travel fatigue and circadian disruption shape away-team outcomes. Experimental-style evidence from baseball links jet-lag effects to measurable performance changes, a mechanism analysts can incorporate when interpreting home-minus-away run margins PNAS study on jet lag in MLB.
Applying run-differential and schedule-aware slicing
Use home-minus-away run differential as MLB's primary scoring metric and slice the season by itinerary features such as extended road trips, number of time zones crossed, and days off between series. Baseball-Reference provides the team-level runs and splits needed to implement this schedule-aware approach Baseball-Reference season page.

When analysts include travel-aware variables in regression or matched comparisons, they can better separate travel-driven home advantage from other factors such as team quality or park effects. Always document how you code itinerary variables and report robustness checks. See our post on evaluations for methodology notes.
NHL: home-ice effects and goal-margin measures
Goal differential and overtime structures
For hockey, home-minus-away goal margin is the standard scoring-based metric. Hockey-Reference supplies team splits including goals for and against at home and away, which allow direct computation of those differentials and the construction of overtime-adjusted checks where necessary Hockey-Reference season page.
Contextual factors unique to hockey
Factors such as roster travel logistics, short-term injuries, and the role of overtime rules can affect single-season splits. Analysts should flag small-sample uncertainty for teams with limited home or away games in their slice and consider multi-season aggregation when appropriate.
Premier League: crowd, officiating and VAR implications
Why standardized officiating matters
In football the decision-making environment is strongly shaped by officiating protocols. The 2024-25 Laws of the Game and league VAR procedures create a standardized context that can moderate crowd-related variations in referee calls; analysts should treat officiating rules as part of the season context when comparing home advantage across years IFAB Laws of the Game 2024/25.
How VAR and Laws of the Game can moderate crowd effects
VAR procedures and clear protocol changes can reduce or redistribute the influence of crowd pressure on on-field decisions, so when comparing Premier League seasons analysts should note the applicable laws and any documented VAR procedure changes that season. Use FBref's home and away splits as the starting dataset and annotate any rule differences when reporting cross-season comparisons FBref Premier League stats.
Mechanisms that produce home advantage
Travel and circadian disruption
Travel fatigue and circadian disruption are well-documented mechanisms that impair away-team performance in travel-heavy leagues; the baseball-focused evidence provides a transferable framework for other leagues with heavy travel schedules PNAS study on jet lag in MLB. A complementary statistical perspective is available in a Bayesian analysis of home advantage Bayesian analysis of home advantage.
Crowd effects and officiating bias
Crowd presence can influence player psychology and potentially referee decisions, though the magnitude depends on officiating structures and technology in place. Analysts should model crowd and officiating variables explicitly and check sensitivity to rule or VAR changes using season documentation IFAB Laws of the Game 2024/25.
Scheduling density and sequence such as back-to-backs and long road trips interact with these mechanisms and should be included as covariates or used for conditional slicing in any causal or descriptive analysis Basketball-Reference season page.
Scheduling effects: how sequence and density change the picture
Back-to-backs, extended road trips and rest inequality
Key schedule concepts to define and extract include back-to-backs, extended road trips, rest-day inequality, and consecutive games in the same region. These features can be coded from game logs and from the season pages to compare same-team performance under balanced-rest versus unbalanced-rest conditions Hockey-Reference season page.
How to slice schedules in your analysis
Practical slicing strategies include: compare a team's home-away performance only on games where both teams had at least two days rest; compare outcomes on the second game of a back-to-back versus single-game weeks; and analyze extended road-trip sequences separately. These conditional slices reveal how schedule-induced fatigue contributes to observed home advantage Baseball-Reference season page.
Common mistakes analysts make when comparing leagues
Mixing incompatible metrics
A frequent error is comparing raw scoring margins across sports without normalization. Always label the metric type and, if necessary, convert to effect-size-style metrics within sport so comparisons communicate relative rather than absolute magnitudes FBref Premier League stats.
Ignoring schedule and officiating changes
Another common pitfall is relying on single-season raw numbers without accounting for schedule quirks or rule changes. Document mid-season rule changes, VAR protocol shifts, and schedule irregularities and, where possible, split the data to test for structural breaks IFAB Laws of the Game 2024/25.
Practical examples and short scenarios for analysts
Example 1: league-wide comparison pipeline
Walkthrough: extract team-level home and away records from each season page, compute team-level home win percentages and home-minus-away scoring margins, choose a weighting scheme, and aggregate to league-level values. Save intermediate datasets and produce a small table that shows both team-weighted and games-weighted league aggregates so differences in aggregation methods are transparent Basketball-Reference season page.
Example 2: schedule-aware slicing in MLB
Walkthrough: identify teams with long road trips or frequent time-zone crossings, compute home-minus-away run differentials conditional on trip length and number of time zones crossed, and compare results to the unconditional league aggregate. The PNAS evidence on jet lag provides a conceptual link for why these slices matter when interpreting run-based home advantage measures PNAS study on jet lag in MLB.
Always report limitations, avoid implying guaranteed outcomes, and be explicit about sample sizes and period when drawing conclusions from these scenarios.
Conclusion: what analysts should take away
Summary of recommended practices
Checklist for analysts: use season summaries as primary data sources, standardize metrics by sport before comparing, control for schedule features and officiating contexts, report aggregation method and uncertainty, and recompute magnitudes from the most recent completed seasons before making quantitative claims Hockey-Reference season page.
Next steps for deeper analysis
For deeper work, combine league-level aggregates with opponent-adjusted models, incorporate travel and circadian variables where appropriate, and document any rule or technology changes that could mediate officiating effects. Home advantage persists across leagues but varies in mechanism and magnitude, so treat results as performance-dependent and season-specific Baseball-Reference season page. See the Funded Plays homepage for related tools and resources.
For deeper work, combine league-level aggregates with opponent-adjusted models, incorporate travel and circadian variables where appropriate, and document any rule or technology changes that could mediate officiating effects. Home advantage persists across leagues but varies in mechanism and magnitude, so treat results as performance-dependent and season-specific Baseball-Reference season page.

Use home win percentage for sports scored by wins and home-minus-away scoring margin for sports measured by goals or runs; always standardize by sport.
Both equal-team and games-weighted aggregations are valid; report both if possible and document the choice.
Travel and circadian disruption are documented contributors, especially in travel-heavy schedules, but they are one of several interacting mechanisms and should be modeled alongside schedule and officiating factors.