

Overview: How Garbage Time Distorts Statistics
How Garbage Time Distorts Statistics is a concise way to frame a common problem in modern sports analytics: some minutes in a game carry very little informational value because the outcome is effectively decided. In analytic practice those low-leverage windows are identified with win probability or an event-level Leverage Index and either excluded or down-weighted to avoid inflating counting stats and noisy efficiency measures, improving stability in season-long comparisons FanGraphs Leverage Index
Tag play-by-play events for filtering or weighting
Use to ensure consistent preprocessing
The two dominant responses are simple hard filters that remove extreme win-probability states and continuous leverage weighting that assigns each play a fractional importance based on WP or a Leverage curve. Both approaches are used by practitioners to audit leaderboards and train models that are less sensitive to blowout bias nflfastR WP and EPA guide
In this guide I summarize why garbage time matters, how to operationalize filters and weights, and practical validation steps so you can recompute fairer leaderboards and build model features with less noise. The goal is actionable advice rather than academic proofs, with examples and checks you can run on seasonal play-by-play.

What 'garbage time' means across sports
What 'garbage time' means across sports
Operational definitions vary by sport, but the shared concept is leverage: minutes where the win probability is near certainty and marginal events add little information about skill. In basketball analysts often use play-level win probability or simple time-score windows, while football and soccer work with tailored WP models that reflect possession and stoppage patterns NBAstuffer garbage time guide
In basketball a common sweep uses a combination of score margin and remaining time to flag low-leverage possessions, whereas football models fold in down, distance, and field position so that the same score margin can have different WP implications. Soccer research shows score-state behavior affects passing and shooting rates, so a flat time filter misses tactical shifts that change a stat's meaning StatsBomb score effects
Crucially, garbage time is about information content, not clock minutes: a late two-possession lead with the trailing team pressing can be higher leverage than an early blowout. That conceptual shift is why win probability and Leverage Index are the preferred lenses for modern adjustments FanGraphs Leverage Index
How Garbage Time Distorts Box-Score and Per-Game Statistics
Counting stats are particularly vulnerable. When games run away, bench players and late-rotation contributors get extra minutes against softer defenses, lifting raw season totals and per-game averages without reflecting comparable high-leverage performance. Removing those minutes often reduces apparent production gaps between starters and role players NBAstuffer garbage time guide
See how simple filters change leaderboards
Download a sample before/after leaderboard CSV or try a small adjustment workflow to see how rankings shift
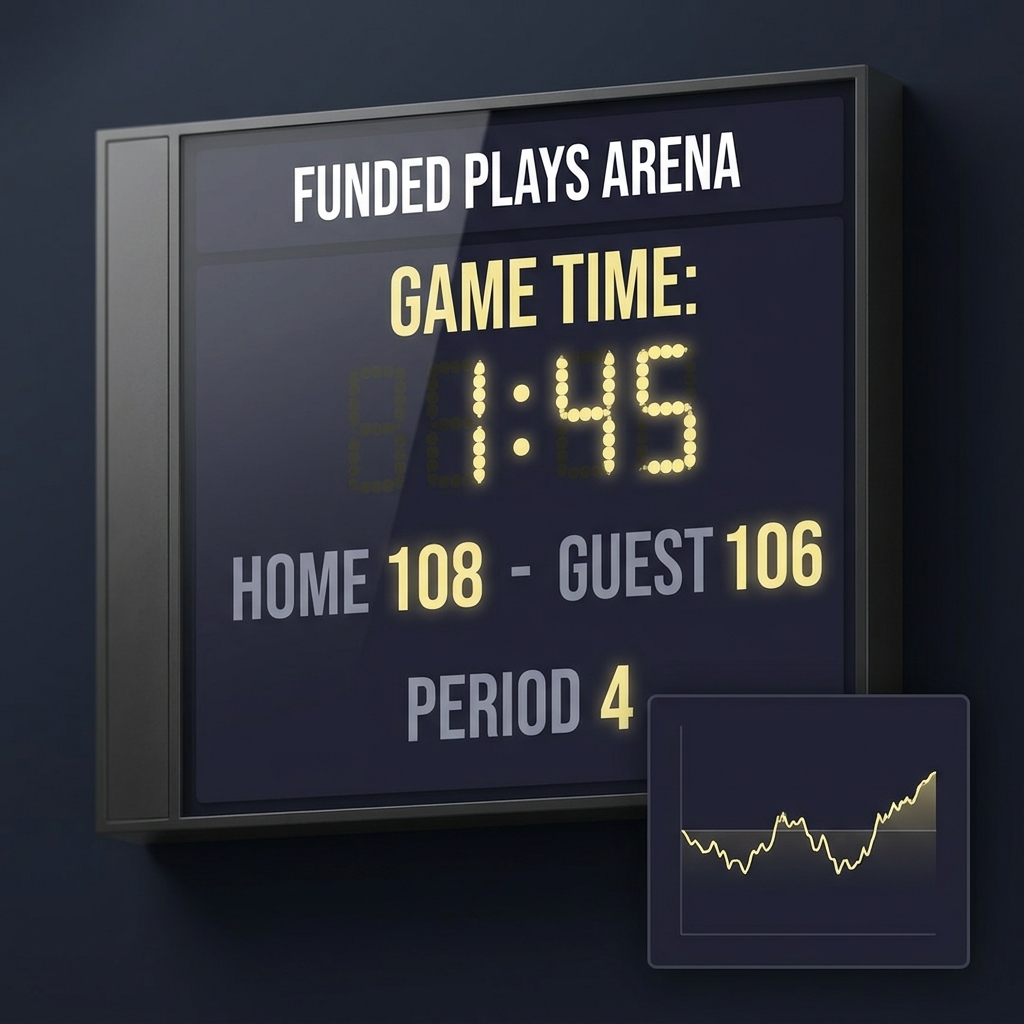
Efficiency metrics are affected too. Per-possession rates assume each possession is comparable, but low-leverage possessions tend to have different shot selection, substitution patterns, and opponent focus, increasing variance. Analysts who strip or down-weight garbage time report more stable efficiency leaderboards and fewer outlier seasons when comparing players across years Dunks and Threes methodology
For modeling, including excessive low-leverage events can bias training labels and features toward blowout patterns that are not predictive of high-leverage outcomes. Adjusted aggregates often yield features that generalize better in out-of-sample tests because they reflect the situations where skill most matters nflfastR WP and EPA guide
Measuring Leverage: Win Probability and Leverage Index
Win probability models estimate the chance a team wins from a game state using inputs such as score, time remaining, possession, and context-specific variables. Those models produce a natural scale for event importance: when WP is extreme, marginal events carry little new information about skill nflfastR WP and EPA guide and see HoopsJunkie win probability methodology. For a Bayesian estimation perspective see this study.
Leverage Index is a complementary concept that measures relative event importance across a contest. Where WP gives an outcome probability, Leverage Index rescales event importance so analysts can compare how consequential a free throw or carry was relative to an average event; both metrics are standard practice for identifying low-leverage windows analysts should treat cautiously FanGraphs Leverage Index
Think of WP as the micro-level probability and Leverage Index as a normalized impact score. Use WP when you want a direct probability cutoff, and use Leverage when you need a relative weight that accounts for game context in a compact form.
Two practical approaches: hard filters versus continuous leverage weighting
There are two robust strategies in use. Hard filters remove events below or above a WP threshold, for example excluding plays when win probability is less than 5 percent or greater than 95 percent. This yields transparent aggregates that are easy to explain and reproduce NBAstuffer garbage time guide
Identify low-leverage events with win probability or Leverage Index, then either apply transparent filters or use continuous weights; validate thresholds with sensitivity analysis and report raw and adjusted metrics side-by-side.
Continuous weighting retains all events but scales them by importance. A simple implementation multiplies each event's contribution by a leverage-derived weight or by WP distance from 50 percent, preserving information while reducing the influence of low-leverage minutes. Analysts favor weighting when sample size is a concern because it avoids throwing away borderline data nflfastR WP and EPA guide
Choose filters for clarity and when stakeholder communication is primary; choose weighting when you need to preserve marginal signal and want smoother adjustments. Both approaches are defensible if you validate sensitivity and document choices Dunks and Threes methodology
Choosing thresholds and sport-specific time-window rules
Common numeric thresholds are simple starting points: a WP cutoff near 5 percent at either tail is widely used to flag near-certain states for removal. The rationale is intuitive: if a team has less than a 5 percent chance to win, incremental events carry little information about eventual winners and player skill NBAstuffer garbage time guide
The NBA's formal 'clutch' window is another standardized benchmark: the last five minutes with a score margin of five points or fewer. That definition helps isolate high-leverage closing sequences but does not capture all important contexts, and it can miss earlier high-leverage swings that occur in overtime or in compressed schedules NBA Stats glossary
Always validate thresholds with sensitivity analysis. Run leaderboards and model metrics at multiple cutoffs to see where rankings stabilize and choose a defensible trade-off between data retention and noise reduction.
Applying filters and weights to leaderboards and models
Start by tagging every play with WP and Leverage values, then either drop tagged low-leverage events or compute weighted aggregates. Typical steps are: compute WP per event, assign weight or boolean flag, aggregate counts with weights, and recompute per-possession and per-game rates using the adjusted totals nflfastR WP and EPA guide. For an implementation reference on in-game probability calculations see this guide.

When you publish leaderboards, present raw and adjusted tables side-by-side and document the method. For further reading see the Funded Plays blog. For models you can train on weighted examples or exclude low-leverage plays, but always cross-validate to verify that adjusted features improve out-of-sample performance and do not simply fit idiosyncrasies of a filtered subset Dunks and Threes methodology
Reporting both versions reduces confusion among stakeholders and preserves the ability to audit decisions; show a small sample of tagged events so others can reproduce the adjustment logic.
Case study: basketball leaderboards with and without garbage-time minutes
In basketball, bench players often accumulate minutes late in blowouts and those extra possessions inflate per-game and season totals. Removing low-leverage minutes typically reduces counting-stat gaps between deep bench players and situational starters because the blowout minutes disproportionately favor players who enter in garbage time NBAstuffer garbage time guide
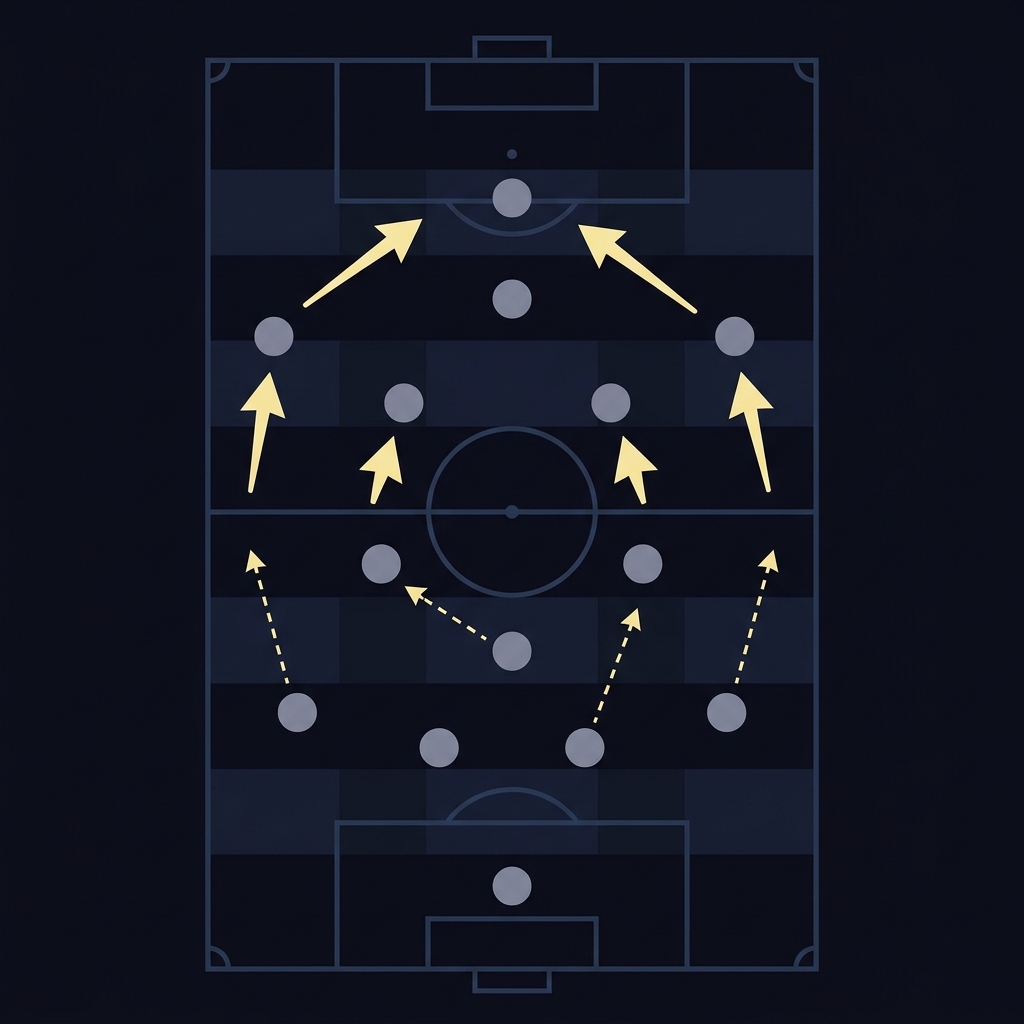
Efficiency leaderboards also become less noisy. When analysts recompute per-possession metrics without extreme WP possessions, single-season outliers regress toward longer-term norms, and leaderboards reflect performance in moments that truly matter rather than the accumulation of low-leverage volume Dunks and Threes methodology
Replicate this on a subset of games first: tag plays, filter or weight, and produce before/after leaderboards. Pay attention to role definitions because players who shift roles under different coaches or rotations can show divergent adjustments that are meaningful rather than erroneous.
Case study: soccer score effects and how they bias raw counts
Soccer exhibits strong score effects: teams that lead tend to slow passing tempo, protect possession, and substitute to preserve the result, while trailing teams take more risks and generate different shot profiles. Those behavioral shifts mean raw counts like shots or progressive carries can reflect game state more than underlying skill StatsBomb score effects
Because soccer has continuous flow and unlimited substitutions in many competitions, simple time-based filters are often inappropriate. Instead, weighting by WP or using score-state buckets that mirror tactical changes produces adjusted totals that better reflect contribution under comparable circumstances.
Best practices: auditing, validation, and reporting
Begin with sensitivity analysis. Recompute leaderboards at multiple WP cutoffs and with alternative weighting curves to see how rankings shift, and report the bands where ranks are stable. Sensitivity checks show whether your thresholds are driving results or if patterns hold robustly across reasonable choices nflfastR WP and EPA guide
For model validation use cross-validation and out-of-sample testing. Compare model performance when trained on raw features, filtered datasets, and weighted aggregates. If weighting improves generalization, it likely captures signal rather than cutting noise that harms prediction Dunks and Threes methodology
Document everything: the WP model source, the exact thresholds or weighting function, the number of events excluded or effective sample size after weighting, and code or pseudocode to reproduce the pipeline. Transparent methodology notes make audits and future updates easier.
Common mistakes when adjusting for garbage time
An overly aggressive filter that removes too much data can bias analysis toward a tiny sample of rare high-leverage moments. That reduces statistical power and can overstate instability when the retained sample is not representative of typical play NBAstuffer garbage time guide
Another common error is ignoring substitution and role changes. Players who operate mainly in bench or situational minutes need role-based splits so adjustments do not misattribute role effects to skill. Always compare minutes distribution and role-based splits before and after filtering Dunks and Threes methodology
Finally, avoid double-counting weight effects. If you down-weight events and then normalize by minutes in a way that negates the weight, you can unintentionally reintroduce blowout bias. Sanity checks and small-scale replication protect against these mistakes.
Step-by-step workflow: from play-by-play to adjusted metrics
Data inputs: cleaned play-by-play with timestamps, score, possession indicators, substitution events, and player mappings. These fields let you compute WP and identify who was on court or on pitch for each event nflfastR WP and EPA guide
Processing steps: compute WP or Leverage, tag events with weights or flags, apply filter or weight during aggregation, recompute per-possession and per-game metrics using adjusted totals, and run sensitivity checks across cutoffs. Keep intermediate datasets so you can reproduce any leaderboard variant Dunks and Threes methodology
Reporting checklist: publish raw and adjusted leaderboards, the WP model source, thresholds or weighting function, number of events affected, and a short note on substitution handling. This checklist converts directly into reproducible scripts you can store in version control. See how Funded Plays evaluations work for an example checklist.
Explaining adjusted stats and limitations to stakeholders
Present a side-by-side leaderboard with a short caption on the method used. Keep the language non-technical: say that adjustments reduce the influence of low-leverage minutes and that both raw and adjusted views are provided so readers can inspect the difference without losing context Dunks and Threes methodology
Use simple visuals: a before/after rank-change plot, a minutes distribution histogram, and a sensitivity ribbon that shows how rank bands shift under alternative thresholds. These visuals communicate the scale of adjustments without requiring stakeholders to follow model details.
Conclusion: practical takeaways on making metrics fairer and more reliable
Garbage time is a low-leverage phenomenon identifiable with win probability or Leverage Index, and adjusting for it reduces bias in counting stats and stabilizes efficiency leaderboards. Both hard filters and continuous weighting are defensible options when accompanied by sensitivity checks and transparent reporting FanGraphs Leverage Index
Pick an approach that fits your use case: filters for interpretability, weighting for sample preservation. Always document the WP source, thresholds, and how substitutions were handled, and publish raw and adjusted outputs side-by-side so users can see the effect for themselves nflfastR WP and EPA guide. Visit the Funded Plays homepage for more on related work.
Garbage time refers to low-leverage game states where the result is effectively decided and marginal events add little information about skill.
Not necessarily, test both hard filters and continuous weighting and run sensitivity checks to determine which preserves signal for your use case.
A common rule is to flag plays with win probability below 5 percent or above 95 percent, but thresholds should be validated for each sport and model.
References
- https://library.fangraphs.com/misc/leverage-index/
- https://www.nflfastr.com/articles/ep-wp.html
- https://www.nbastuffer.com/analytics101/garbage-time/
- https://statsbomb.com/articles/soccer/score-effects/
- https://dunksandthrees.com/about
- https://www.nba.com/stats/help/glossary
- https://www.fundedplays.com/challenges
- https://www.fundedplays.com
- https://www.fundedplays.com/blogs
- https://www.fundedplays.com/blogs/how-fundedplays-evaluations-work
- https://hoopsjunkie.io/methodology/win-probability
- https://metricgate.com/docs/in-game-win-probability-football/
- https://www.researchgate.net/publication/362323955_Bayesian_estimation_of_in-game_home_team_win_probability_for_Division-I_FBS_college_football