
What expected goals measure and why xG matters
Definition of xG on a 0 to 1 scale
Expected goals, often written as xG, estimate the probability that a shot will become a goal on a 0 to 1 scale by learning from historical shots and their contexts. This measure combines factors such as shot location, body part, assist type, and pressure to produce a single probability for each attempt, which helps quantify chance quality rather than relying on raw goal counts The Analyst xG explainer.
Trust in evaluation grows when chance quality is measured alongside goals; xG provides a structured way to compare opportunity quality and reduces the weight of single-match randomness.
Because goals are rare events and influenced by finishing luck, xG provides a clearer sense of whether a team created high-quality chances even when results do not match the opportunity picture. By standardizing chance quality across shots, analysts can compare offensive and defensive performance in a way that reduces the noise of single-match outcomes, a practice that by 2026 is part of mainstream elite soccer analysis FBref expected goals model explained.
Why chance quality is different from raw goals and shots
Raw counts such as goals or total shots mix opportunity and finishing, so two teams with the same goals can have very different underlying performances if one created higher-quality chances. xG isolates the quality component and, over samples, gives a better signal for evaluation and forecasting than raw outcomes alone Journal of Sports Analytics study.
How basic xG models are built
Common input features used in event-data models
Most mainstream xG models are event-data models that start from large collections of past shots and record features like shot location, shot type, body part, assist type, and game state. These inputs form the foundation for a model to distinguish high-probability from low-probability attempts; providers typically publish methodology notes that list these inputs so analysts can understand what drives each xG value FBref expected goals model explained.
Overview of supervised learning on historical shots
Technically, many providers use supervised learning approaches: a model is trained on thousands of past shots where the outcome is known, and the model learns which combinations of features have historically produced goals. The result is a calibrated probability for new shots, tuned so that average xG over many shots matches observed conversion rates in similar conditions StatsBomb methodology notes (see an alternative model example on Medium Expected Shot Danger).

Advanced inputs and xG variants: pressure, goalkeeper data and xGOT
What pressure and goalkeeper positioning add to xG
Enhanced xG variants add contextual signals such as defensive pressure or goalkeeper positioning to adjust shot probabilities where event data allow these details. When available, these inputs change a shot's estimated probability because a well-positioned goalkeeper or heavy pressure typically reduces the chance of scoring compared with an identical shot without those constraints The Analyst xG explainer (see Opta's insights on post-shot adjustments StatsPerform).
a short checklist for inspecting enhanced xG visuals
Use to guide match reading
The xGOT concept and why on-target splits matter
On-target expected goals, often abbreviated xGOT, re-estimate the probability of a shot becoming a goal conditional on it being on target and incorporate shot placement into the quality assessment. Splitting a sample into xG and xGOT helps separate finishing from chance creation by showing how much of a team's scoring record comes from high-quality placed shots versus general opportunity volume FBref expected goals model explained.
How analysts and teams use xG for evaluation
Team-level metrics: xG and xG difference
At the team level, total xG and xG difference (xGD) are straightforward summaries of chance creation and concession. By aggregating shot probabilities across matches, xGD shows whether a team consistently creates more quality chances than it allows, which is useful for identifying strengths and weaknesses beyond single-match fluctuations Journal of Sports Analytics study.
Why xG can be more stable than raw goals over multiple matches
Peer-reviewed research indicates that team-level xG and xGD typically outperform raw goals or shot counts when predicting future results across multi-match samples, because they reduce the influence of finishing variance and rare events. For team analysts, this means using xG across windows of matches improves predictive stability for form assessment and forecasting Journal of Sports Analytics study.
Translating xG into decisions: trends, samples and thresholds
Rolling xG trends and sample-size guidance
Effective decision-making with xG starts by smoothing short-term noise. Use rolling windows - for example, multi-match averages or weighted windows - to detect persistent shifts in chance quality rather than reacting to single-match spikes. These rolling trends should be paired with explicit sample-size rules so that conclusions are only drawn when they exceed pre-defined thresholds The Analyst xG explainer. See the Funded Plays blog here.
As a rule of thumb, avoid making firm judgments from very small samples. Analysts commonly prefer multi-match windows because small-sample volatility is a known limitation, especially at the player level. Combining rolling xG with on-target splits like xGOT helps clarify whether a change in goals reflects finishing or a change in chance creation StatsBomb methodology notes.
Practice xG forecasting with FundedPlays challenges
Practice xG-based forecasting in a structured, skill-focused challenge environment using a funded sports prediction challenge platform to test methodology and discipline without wagering real money.
When to trust xG numbers and when to wait
Trust grows with sample size and consistent signal across complementary metrics. If a team shows a sustained xG advantage across several windows and this aligns with shot maps and video-confirmed tactical patterns, it is reasonable to act on that signal. If signals are mixed or depend on a few high-xG events, wait for more matches or perform targeted video checks before adjusting tactical or scouting conclusions FBref expected goals model explained.
Interpreting xG at player level: finishing versus chance creation
Why player xG is noisy and how to reduce error
Player-level xG has higher variance because individual shot counts are small and finishing skill can differ substantially from historical averages. For player evaluation, use larger aggregated samples, include on-target splits, and compare shot-quality distributions to reduce error from a few fortunate or unfortunate games StatsBomb methodology notes.
Using xGOT and shot-quality profiles for player scouting
Scouts and analysts should combine xGOT with shot-location heatmaps and shot-quality distributions to distinguish players who consistently create high-quality chances from those who benefit from good finishing circumstances. Video review remains essential to confirm the context behind a numerical pattern before making roster or tactical recommendations FBref expected goals model explained.
Walkthrough: reading a match using xG visuals and commentary
Step-by-step reading of a match xG timeline and shot map
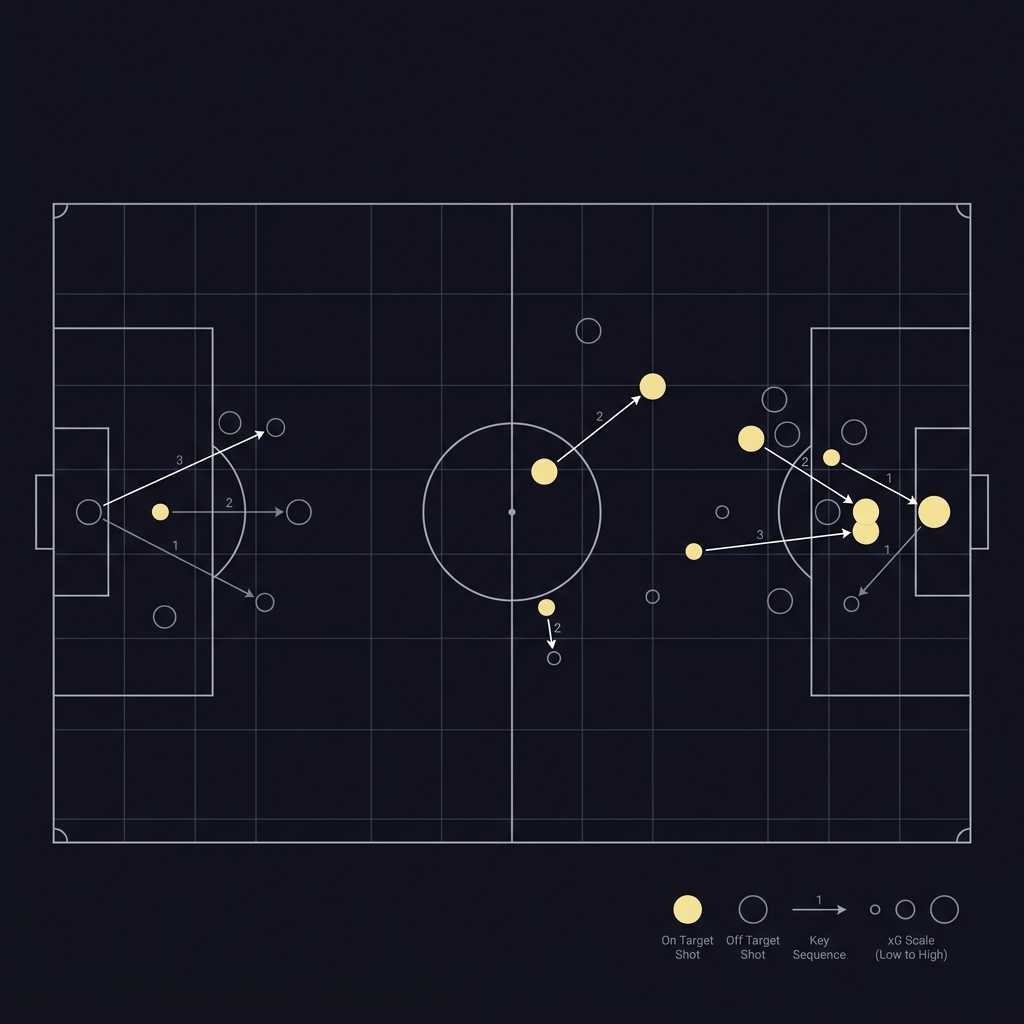
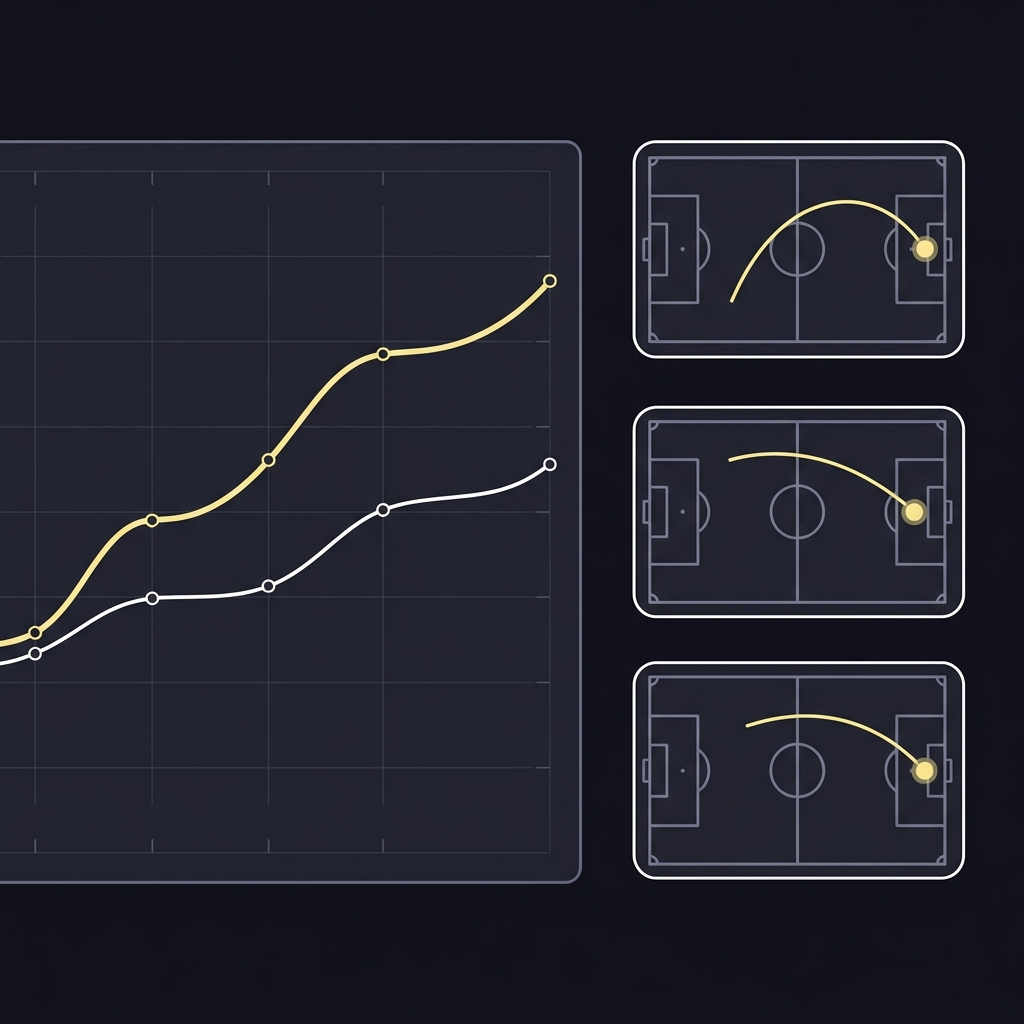
Start a match read by reviewing the xG timeline to see when chances clustered and whether the flow of the game favored one side. Follow with a shot map to identify where high-probability attempts originated and note any recurring channels of chance creation; these steps help translate numbers into narrative and tactical insight The Analyst xG explainer.

Next, cross-check the visual story with video: confirm whether the shot map's high-xG areas came from build-up play, set pieces, or opponent errors. Official reports have used this combination of timeline, map, and commentary to explain match stories in recent tournaments and help readers see why outcomes followed the chance picture UEFA EURO 2024 technical report. See the Funded Plays homepage Funded Plays.
How official reports used xG in recent tournament coverage
Tournament technical reports have integrated xG visuals to contextualize team performance across fixtures, helping highlight sustainable chance-creation patterns even when single matches produced surprising scorelines. Those reports demonstrate that xG is most informative when paired with tactical description and sample-aware interpretation UEFA EURO 2024 technical report.
Common pitfalls and misuses of xG
Mistaking model numbers for absolute truth
xG is an estimate, not an absolute. Mistakes occur when analysts treat a provider's xG number as an incontrovertible fact rather than a model output that depends on inputs and calibration choices. Always document the provider and model version behind the numbers to avoid overconfident conclusions FBref expected goals model explained.
Ignoring context and small samples
Interpreting a single match or a handful of shots as conclusive is a common misuse. Small-sample noise can mislead unless analysts apply explicit thresholds and confirm signals with complementary evidence such as xGOT splits and video review Journal of Sports Analytics study.
Comparing xG across providers: calibration and comparability
Why FBref, Opta and StatsBomb numbers can differ
Different publishers use varying inputs and calibration procedures, so reported xG values can differ even for the same shot set. Differences stem from which contextual fields are available and how models are tuned, which means absolute xG numbers are not always directly comparable across providers The Analyst xG explainer.
Practical methods for cross-provider comparison
When comparing providers, record input and calibration differences, consider re-calibrating scales to a common baseline, or rely on relative metrics such as xG difference instead of raw xG totals. Provider documentation is essential to inform these adjustments and avoid misleading comparisons StatsBomb methodology notes.
How xG can inform scouting and tactical analysis
Using shot-location and chance-creation profiles for tactics
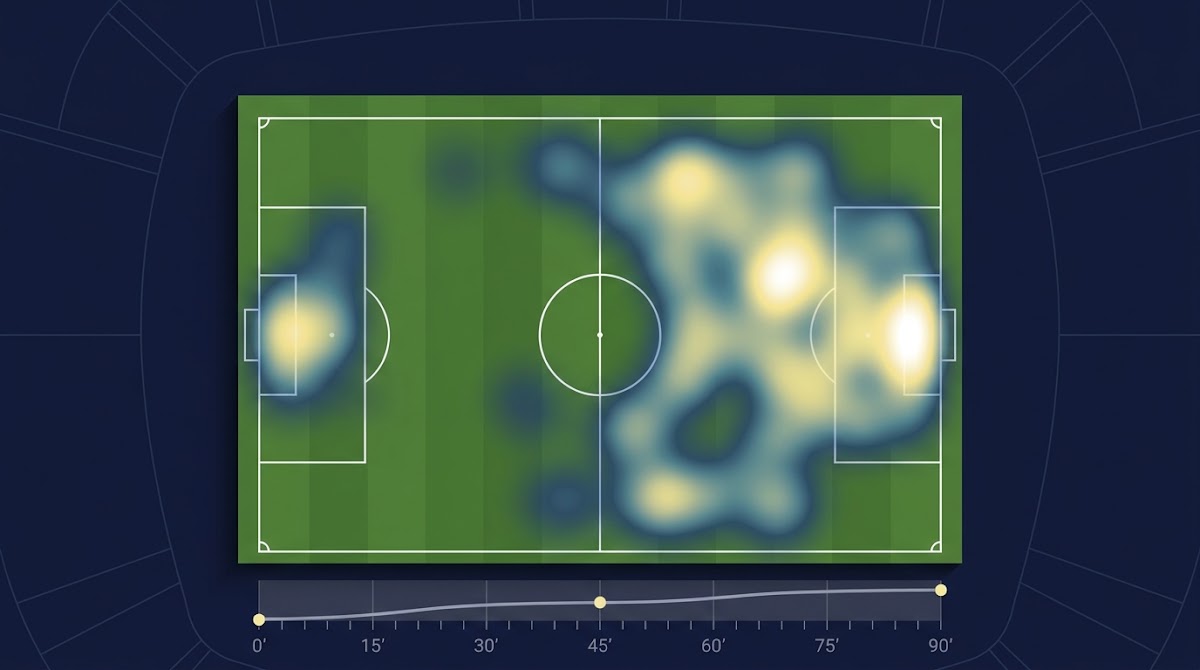
Shot-location heatmaps and channel breakdowns show where a team tends to create or concede chances, which supports tactical adjustments. Identifying whether chances come from central penetration, wide crosses, or set pieces helps coaches target defensive or offensive work in training The Analyst xG explainer.
Combining xG with event-level context and video
xG should be used alongside event context and video analysis. Numbers point to patterns, and video confirms causation, such as a recurring defensive error or a particular player movement that creates high-xG opportunities. This combined workflow reduces false positives and guides actionable scouting recommendations FBref expected goals model explained.
Responsible use: analytics, simulation and decision limits
Using xG in simulations and model-based forecasting
xG is a valuable input for simulations and forecasts, but it must be treated as probabilistic and uncertain. Simulations that use xG should explicitly model uncertainty and avoid presenting point estimates as guaranteed outcomes; this preserves clarity about what the model can and cannot say StatsBomb methodology notes.
Ethical and practical limits on decision-making from xG
Analysts should communicate limits and sample-size caveats clearly when sharing xG-based recommendations. Presenting results without uncertainty or suggesting guaranteed success from following model-driven choices undermines responsible practice and can mislead decision-makers FBref expected goals model explained.
Known limitations and open research questions in xG
League and era transferability
xG models calibrated in one league or era may not transfer cleanly to another because playing styles, referee behavior, and data collection can differ. Analysts should be cautious when applying models across leagues and consider recalibration or relative comparisons instead of absolute claims The Analyst xG explainer.
Separating finishing talent from randomness
Separating true finishing ability from short-term variance remains an open question. Better goalkeeper and pressure data help, but peer-reviewed work still emphasizes sample-aware approaches and the need for continued research into model improvements and standardized calibration across providers Journal of Sports Analytics study (see probabilistic reformulation research ScienceDirect).
A practical checklist: building an xG-informed analysis workflow
Data, time windows and cross-checks
Begin with a clear question, choose one or more providers and document their model details, set explicit time windows for analysis, and run splits such as xGOT and on-target rates. Always validate surprising signals with video to confirm the tactical or situational drivers behind numbers FBref expected goals model explained.
Deliverables: reports, visualizations and next-step actions
Deliver concise reports that include shot maps, xG timelines, a statement of uncertainty, and recommended next steps such as targeted video clips or training focuses. Document model version, data source, and any adjustments to maintain reproducibility and clarity for stakeholders StatsBomb methodology notes. Read how our evaluations work here.
Conclusion: how xG improves soccer analysis and cautious next steps
Key takeaways
xG adds a measure of chance quality that improves multi-match evaluation when used with proper sample sizes and context. Analysts should combine rolling trends, on-target splits like xGOT, and video confirmation to make more reliable inferences about teams and players The Analyst xG explainer.
Further reading and where to learn more
For deeper methodological notes and official examples, consult provider documentation and tournament technical reports that demonstrate best practices for integrating xG into match and tournament analysis UEFA EURO 2024 technical report.
xG is a probability estimate for each shot, indicating how likely that shot was to become a goal based on historical similar shots and contextual details.
xG improves predictive stability over multi-match samples, but it is not a guarantee; reliable predictions require adequate sample sizes and complementary evidence.
Yes, with caution: use larger samples, xGOT splits and video to separate finishing skill from chance creation before making decisions.