

What correlated trades are and why they matter
Correlated trades are positions that load on the same underlying risk factors, so their returns tend to move together and aggregate drawdowns can increase even when the instruments appear different on the surface. This plain definition helps explain why superficially diversified portfolios sometimes suffer simultaneous losses when a single driver shifts, and why routine checks for common factor exposure are essential for risk managers and traders alike BIS Annual Economic Report 2024.
Think of correlated trades as several boats tied to the same anchor. If the anchor drags, all boats move together even if they face slightly different winds or currents. That simple analogy captures how correlation reduces diversification benefits at the portfolio level and raises the chance of larger consolidated drawdowns when common drivers change.
Explore structured challenge templates and correlation checklists
Download a short correlation checklist to add routine scans into your pre-trade and end-of-day reviews, or sign up to demo a structured challenge workflow that embeds correlation checks into evaluation routines.
Practitioners call out several common channels for apparent diversity to mask shared risk: names in different sectors that load on the same macro factor, instruments across asset classes that respond to the same rate or inflation shock, and style exposures that cut across industry labels. Spotting these patterns requires looking beyond surface labels to factor-level exposures and correlation patterns.
Core definition
At its core, correlated trades risk arises when positions are exposed to the same macro, sector, or style factor. These are not necessarily identical securities, but they share drivers that can make them move together in stressed states. Detecting this requires both pairwise correlation checks and broader factor-exposure analysis to avoid false comfort from nominal instrument diversification ESMA Trends, Risks and Vulnerabilities Report 2024.
Why similar drivers cause co-movement
When multiple positions load on the same risk factor, their idiosyncratic returns may cancel out in calm markets, but the common component can dominate during regime shifts. That shared component increases portfolio variance and produces losses that occur together rather than offset each other. Risk managers who only inspect headline asset allocation may miss this structural co-movement.
How correlated trades can amplify hidden portfolio risk
Aggregation arithmetic explains the amplification. Portfolio variance depends on individual position variances and the covariances between them, so positive covariance from correlated trades raises overall portfolio variance faster than independent bets. In plain terms, two positions that move together increase the chance of simultaneous loss, thereby increasing peak-to-trough drawdowns and stress losses relative to a set of independent positions BIS Annual Economic Report 2024.
Consider a simple example where two positions each have similar volatility. If they are uncorrelated, diversification reduces portfolio variance. If instead they have high positive correlation, that reduction disappears and the combined position can lose about as much as each single position in the same stress. This arithmetic makes clear why apparent diversification across instruments can be misleading.
Recent market evidence reinforces the point. Since 2022, episodes of positive stock bond correlation reduced the traditional hedge that bonds provided to equity losses, weakening multi-asset diversification and exposing portfolios to larger aggregate drawdowns in episodes where both markets moved together MSCI Research on stock bond correlation.

When cross-asset co-movement rises, commonly used hedges can become less effective because the hedge instrument and the protected position can move in the same direction or stop providing offsetting returns. That erosion of hedge utility is a key channel by which correlated trades amplify hidden risk in multi-asset portfolios.
Mechanics of loss amplification
Loss amplification happens through two intertwined channels: higher covariance among positions and simultaneous liquidity or funding stresses that worsen realized losses. Correlation-driven covariance increases expected variance, while liquidity-driven co-movement can deepen realized drawdowns because selling correlated instruments in stress can push prices further and create feedback loops.
Beyond simple arithmetic, behavioral and market-structure effects make correlated downside worse. Forced deleveraging, crowded positioning, and common liquidity pools can turn an idiosyncratic shock into a broader event where many positions move together, especially if market participants rely on similar signals or models for risk control.
Recent market episodes that illustrate the risk
From 2022 through 2025, several episodes showed that stock and bond returns moved together more often than in prior decades, reducing the historical benefit of holding bonds to offset equity risk and highlighting an elevated correlation regime that managers must consider when assessing diversification IMF Global Financial Stability Report April 2025.
These episodes illustrate that hedges are not static. Instruments that historically provided offsetting returns can stop doing so when the underlying drivers change, so risk teams should monitor correlation regimes rather than assuming persistent negative correlation across asset classes.
Detecting correlated trades: correlation matrices and factor exposure maps
Practical detection starts with pairwise correlation matrices that show how returns co-move across the portfolio. A correlation matrix provides a compact view of pairwise relationships and helps flag clusters of positions that exhibit high covariance over the chosen sample window MSCI Research on stock bond correlation. Academic frameworks for correlation stress testing provide complementary guidance Correlation scenarios and correlation stress testing.
Construct a matrix from clean return series, choose sensible time windows, and compute rolling correlations to reveal changing relationships. Short windows can be noisy while very long windows can hide regime shifts, so a combination of horizons often gives a clearer picture than a single static estimate.
Detect with rolling correlation matrices and factor-exposure maps, quantify with variance decomposition and stress scenarios that uplift correlations, and control with factor-level diversification, targeted tail hedges, and strict sizing and drawdown rules.
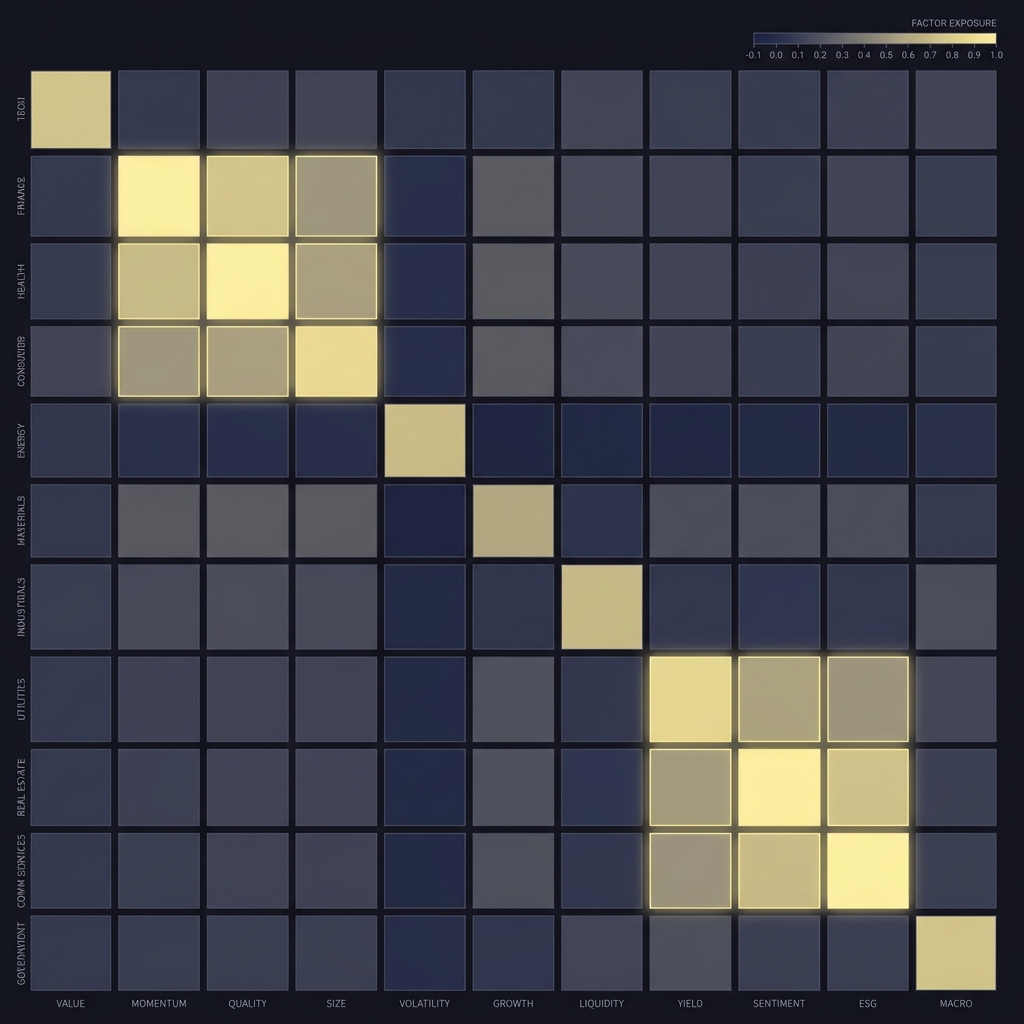
Factor-exposure mapping extends the matrix approach by decomposing positions into exposures to common drivers such as rates, inflation, commodity prices, and style factors. Mapping each holding to factor loadings and then visualizing those loadings as a heatmap or clustered table reveals overlapping bets that asset labels alone do not disclose ESMA Trends, Risks and Vulnerabilities Report 2024.
When you spot clusters in a factor-exposure heatmap, investigate whether those clusters are concentrated in names, sectors, or instruments that face the same macro driver. That investigation is the practical step that turns a statistical flag into an actionable risk reduction plan.
Building and reading a correlation matrix
To build a useful correlation matrix, start with cleaned returns, choose appropriate frequency, and compute pairwise Pearson correlations across relevant lookback windows. Display rolling correlations alongside point estimates to see how relationships evolve and to detect sudden correlation spikes that a static snapshot misses.
Pay attention to outliers and to the stability of correlations across windows. If a pair shows wildly different correlations across short and long windows, that suggests regime dependence and the need for stress-testing scenarios that treat correlations as time-varying rather than fixed.
Factor-exposure mapping across names and sectors
Factor maps require either modelled factor loadings or pragmatic proxies. Use a small, interpretable factor set that includes macro drivers most relevant to your portfolio, estimate loadings consistently, and present the results as an exposure heatmap that highlights concentrations by factor rather than by nominal asset class.
Combining factor maps with correlation matrices makes it easier to answer whether apparent diversification is real. If diverse positions share factor loadings and show high pairwise correlations, they are likely correlated trades in disguise and warrant size or hedge adjustments.
Quantitative measures and model limits: variance decomposition, stress calibration
Variance decomposition separates portfolio risk into idiosyncratic and common-factor contributions, making it possible to quantify how much variance comes from shared drivers. This decomposition clarifies whether risk reduction should focus on reducing factor exposures or on picking lower-volatility names within the same factor buckets BIS Annual Economic Report 2024.
In the decomposition, the common-factor term often dominates when many holdings load on the same drivers. That dominance signals concentration at the factor level and argues for mitigation at the exposure level rather than only at the instrument level.
Portfolio variance decomposition
Implement a simple factor model, compute factor contributions to variance, and attribute total portfolio volatility to factors and residuals. Present results as percentages to make the concentration intuitive for governance committees and to set measurable targets for reducing factor risk.
Use volatility contribution rather than just exposure magnitudes. Two positions can have similar factor loadings but very different volatilities, so weighting by volatility reveals where tail losses are most likely to emerge.
Why models can understate risk when correlations spike
Models calibrated to recent, benign correlation regimes often understate potential losses if stress drives correlations higher. Supervisors emphasize that reliance on historical low correlations can give a false sense of security and that scenario- or stress-based calibration is necessary to capture tail co-movement Federal Reserve Financial Stability Report May 2025. See also enhanced transparency guidance on supervisory stress-test models Federal Register notice.
Calibration pitfalls include look-ahead bias, short sample windows that miss regimes, and overfitting to quiet periods. Sound practice triangulates model outputs with stress runs and conservative correlation uplift factors when designing limits and capital cushions.
Stress testing and scenario analysis for correlation risk
Supervisors require stress tests that explicitly consider correlation spikes and concentration vulnerabilities because historical correlations may not hold in adverse states. Designing scenarios that test correlation-driven losses helps firms quantify tail outcomes that standard models miss Federal Reserve Financial Stability Report May 2025. See the Fed's 2026 stress test scenarios for related examples 2026 stress test scenarios.
Effective scenario analysis treats correlations as a variable, not a constant. Sensitivity runs where correlations are increased across factor clusters, combined with plausible simultaneous factor moves, give a clearer view of potential portfolio losses than point estimates alone.
Designing adverse correlation scenarios
Start with plausible but severe correlation shifts: a cross-asset correlation spike where equity bond correlation turns strongly positive, a simultaneous shock to rates and inflation, or a liquidity event that forces correlated selling across specific sectors. Calibrate scenario magnitudes to past stress episodes or to stress multiples recommended by governance.
Translate each scenario into price paths or return shocks, run portfolio revaluation, and analyze which positions and factor contributions drive the largest losses. That mapping shows whether controls should focus on hedges, sizing, or changing the portfolio composition.
Translating scenarios into capital or position limits
Use scenario outcomes to set position-size caps that reflect tail loss potential rather than only expected volatility. Convert worst case PnL into drawdown limits and ensure that aggregated factor exposures remain within governance thresholds under scenario stress.
Where scenario losses indicate concentrated tail exposure, add targeted tail hedges or require larger capital cushions for the affected desks. These actions close the loop between scenario analysis and operational controls IMF Global Financial Stability Report April 2025.

Mitigation playbook: diversification, targeted hedges, and disciplined sizing
Mitigation begins with diversification that targets orthogonality at the factor level rather than relying on coarse asset-class labels. Aim to allocate across exposures that are historically and economically independent or that have low factor correlation under stress BIS Annual Economic Report 2024.

For many teams a practical first step is to rebalance exposures so the largest factor contributions to variance fall below governance thresholds, and then monitor changes with automated scans tied to daily or weekly reports.
Designing independent risk factor cushions
Create cushions by adding positions or hedges that offset major factor contributions rather than adding more instruments that look different but share the same drivers. Factor orthogonality is the goal: if a hedge is truly orthogonal to a concentrated factor, it will reduce tail contribution materially.
Orthogonality can be achieved with modestly sized exposures to carefully chosen instruments or strategies that historically move differently in stress. Where available, use instruments with negative or low correlations to the dominant factor, and validate their behavior in stress runs before relying on them live.
Sizing rules and drawdown limits
Combine volatility parity, explicit drawdown limits, and stop rules to manage aggregated tail exposure. Volatility-adjusted sizing helps balance positions by risk contribution, while drawdown caps stop a desk before correlated losses become systemically large.
Set rule-based limits that reduce exposures as realized correlations rise or when stress signals trigger. Discipline here matters: even well-designed hedges and diversification rules fail if governance does not enforce sizing and drawdown rules consistently.
Common mistakes and model blind spots to avoid
A frequent mistake is overreliance on recent, benign data for calibration. Correlations vary over time, and models tuned to calm periods can miss regime shifts that make hedges ineffective and concentration risk larger than expected Federal Reserve Financial Stability Report May 2025.
Run a quick correlation scan to flag overlapping exposures
Use recent and rolling windows to detect regime shifts
Another common blind spot is mistaking nominal offsets for true hedges. Positions that look opposite at the instrument level can load on the same factor or become illiquid together, causing hedges to fail in stress. Modelers should test hedges under stressed correlations and liquidity scenarios rather than only analyzing historical average offsets Bank of England Financial Stability Report November 2024.
Governance errors compound model blind spots. Missing routine correlation and stress controls, weak limits that ignore tail co-movement, and lax approval processes allow correlated trades to accumulate unnoticed. Strong sign-off and regular, documented correlation scans help prevent drift into concentrated factor risk.
Overreliance on recent data
Short windows and look-ahead bias can make correlations appear stable when they are not. Use a mix of rolling windows and regime-aware diagnostics to expose when correlations are likely to move and to avoid decisions based on spurious stability.
Misreading hedges in stress
Test hedges in stress scenarios rather than assuming they hold. Hedging instruments can become illiquid or move with the same drivers in adverse states, and only scenario-based testing will reveal these failure modes reliably.
Scenarios, quick checklist, and concluding takeaways
Scenario 1: Positive stock bond correlation spike. Suppose an inflation surprise drives both equities and nominal bonds lower, creating a strong positive equity bond correlation. Detect the event using rolling correlation spikes and factor contribution shifts, reduce concentrated factor exposures, and deploy targeted inflation-protection instruments or custom tail hedges to limit worst-case drawdowns MSCI Research on stock bond correlation.
Scenario 2: Sector-driven factor shock. Imagine a sudden commodity price shock that hits certain sectors simultaneously. Use factor-exposure maps to spot which holdings load on the commodity factor, trim or hedge those exposures, and stress-test liquidity to ensure hedges remain executable under pressure IMF Global Financial Stability Report April 2025.
Operational checklist to reduce hidden risk
Create a short operational checklist for routine use: run daily pairwise correlation scans, weekly rolling-window reviews, monthly factor-exposure heatmaps, quarterly stress tests that uplift correlations, and governance sign-off on any large factor rebalancing. Tie these checks to stop-loss and drawdown rules so scans trigger immediate operational responses when thresholds breach.
Close the loop by assigning owners for each control, documenting decisions, and reviewing outcomes after any realized stress. This operational discipline keeps correlation and concentration risk visible rather than hidden.
Operational checklist
Final takeaways
Final takeaways
Correlated trades increase hidden risk because they concentrate losses around common drivers, and standard diversification assumptions can fail when correlations change. Routine correlation scans, factor mapping, stress testing that treats correlations as variable, and disciplined sizing are practical and regulator-aligned controls to manage this vulnerability IMF Global Financial Stability Report April 2025.
Adopt the operational checklist, test hedges in adverse correlation states, and use variance decomposition to guide mitigation. These steps help convert correlation awareness into concrete risk reduction rather than into a theoretical concern.
Correlated trades share common risk drivers so their returns move together, which can erode diversification even when instruments look different.
Run a pairwise correlation matrix and a factor-exposure heatmap using rolling windows to reveal overlapping factor loadings.
Translate scenario losses into position size caps, add targeted tail hedges, and require larger capital or drawdown buffers for affected exposures.
References
- https://www.bis.org/publ/arpdf/ar2024e.htm
- https://www.esma.europa.eu/press-news/esma-news/esma-publishes-trends-risks-and-vulnerabilities-report-2-2024
- https://www.msci.com/insights/has-the-stock-bond-correlation-turned-positive-for-good
- https://www.imf.org/en/Publications/GFSR/Issues/2025/04/Global-Financial-Stability-Report-April-2025
- https://www.federalreserve.gov/publications/2025-may-financial-stability-report.htm
- https://www.fundedplays.com/challenges
- https://www.bankofengland.co.uk/financial-stability-report/2024/november-2024
- https://www.federalreserve.gov/publications/2026-stress-test-scenarios.htm
- https://www.sciencedirect.com/science/article/pii/S0167268122004061
- https://www.federalregister.gov/documents/2025/11/18/2025-20211/enhanced-transparency-and-public-accountability-of-the-supervisory-stress-test-models-and-scenarios
- https://www.fundedplays.com
- https://www.fundedplays.com/blogs
- https://www.fundedplays.com/blogs/how-fundedplays-evaluations-work