

What conference strength means and why market perception matters
Conference strength describes the aggregate quality signal that emerges from a group of teams playing mostly within the same league, distinct from any single team's intrinsic ability. It is a function of opponent quality, schedule balance, and how those games expose teams to different levels of competition. Foundational rating theory explains why adjusting for schedule is essential when inferring true team and conference strength from unbalanced schedules Statistical Models Applied to the Rating of Sports Teams.
Markets and evaluators treat conference signals as noisy but informative priors. A conference with consistently strong opponent-adjusted ratings will tend to influence public narratives and market expectations, even when some teams do not individually merit the same credit. The difference between reputation-driven perception and schedule-adjusted evidence is central to avoiding systemic mispricing. This broader "rankings effect" on perception has parallels in higher-education rankings discussions rankings effect.
Unbalanced schedules and uneven nonconference slates amplify perception effects. When teams in one conference face easier nonconference opponents while avoiding top out-of-league competition, raw win-loss records overstate team strength unless corrected by schedule-adjusted methods. That is why ratings and selection frameworks focus on opponent quality and location rather than headline records alone.
Quick diagnostic to compare conference residuals across a season
Use weekly updates to spot drifting biases
How major evaluators embed conference strength in rankings and selection
NCAA NET framework components
The NCAA NET framework combines game results, efficiency measures, opponent quality, and game location to create a standardized baseline for comparing teams across conferences. Analysts can treat NET as a compact, committee-facing summary that emphasizes schedule-related details rather than reputation alone NET rankings explained. For an additional committee-facing explainer see the NCAA media center overview how NET rankings work.
Committee principles for selection and seeding
Committee procedures for Division I men's basketball explicitly list strength of schedule and team-sheet metrics among the inputs used for seeding and selection. These documented procedures show how authoritative evaluators operationalize schedule information as part of a larger decision process 2024-25 Division I Men s Basketball Committee Principles and Procedures.
The College Football Playoff selection protocol likewise lists strength of schedule together with head-to-head comparisons and common opponents as core evaluation criteria, which shapes public narratives in seasons where conference imbalance is visible Selection Committee Protocol (2015). See the CFP site for a related committee protocol document Selection Committee Protocol (2016).
Rating systems that enable cross-conference comparability
FPI and expected point margins
Opponent-adjusted ratings translate game performance into an expected point margin versus an average opponent. ESPN s FPI frames team strength in this way, which helps modelers convert relative ratings into intuitive spreads and probabilities while preserving opponent adjustments What is ESPN s Football Power Index.
SRS and schedule-adjusted differentials
The Simple Rating System estimates a team s point differential after adjusting for strength of schedule and produces a conference-agnostic baseline that is straightforward to incorporate into forecasting pipelines College Football SRS Explained.
Because both FPI-style and SRS-style measures remove much of the raw schedule noise, they should be the starting point before any conversion to market-facing prices. Using schedule-adjusted ratings early avoids confusing conference-level effects with genuine team-level signals.
See challenge structures and evaluation rules on the FundedPlays Challenges page
Download a starter checklist or sign up for model templates to begin integrating schedule-adjusted ratings into your workflow.
Translating schedule-adjusted ratings into prices and probabilities
From rating differentials to spreads and win probabilities
Start with opponent-adjusted team ratings as the baseline, then map rating differentials into spreads and win probabilities using a calibration step that reflects market-implied volatility. When the baseline already accounts for opponent quality, the mapping focuses on converting relative strength into an expectable margin and probability distribution, not on correcting for conference imbalance What is ESPN s Football Power Index.
Where conference effects enter the pricing pipeline
Conference signals enter the pricing pipeline during calibration and residual correction. After converting ratings to prices, include schedule-strength covariates and game-location adjustments to avoid confounding conference effects with home-field advantage or travel impacts. The NET framework s incorporation of location demonstrates why this step matters for accuracy NET rankings explained.
Finally, test model outputs against market closing behavior and implied volatility. Uncalibrated ratings that do not respect market dispersion will produce systematically mispriced spreads and probabilities, so reserve room in your pipeline for calibration and iterative alignment.
Practical adjustments: hierarchical shrinkage and schedule reweighting
When team-level samples are small or nonconference slates are unbalanced, hierarchical shrinkage helps by pulling extreme team estimates toward conference baselines. The conceptual basis for shrinkage comes from rating theory and regularization strategies that reduce variance when direct observations are limited Statistical Models Applied to the Rating of Sports Teams.
Shrinkage is most useful when a team's rating is driven by a small number of games against weak opponents. Rather than replace opponent-adjusted ratings, use shrinkage to temper estimates and improve out-of-sample stability.
Start with opponent-adjusted ratings, then apply hierarchical shrinkage and schedule reweighting only when sample sizes or residual patterns indicate systematic bias, and validate changes against committee metrics and market closing behavior.
Schedule-strength reweighting is the practical complement to shrinkage. Reweight nonconference games based on opponent tier so that a padded conference record achieved against low-tier nonconference opponents does not inflate a team's projected margin. This reweighting should be guided by the same principles that make schedule-adjusted ratings informative
Combine opponent-adjusted ratings with shrinkage and reweighting instead of swapping one approach for another. The hybrid approach retains the granularity of rating systems while introducing regularization where the data are weakest.
Detecting conference bias: tests and error segmentation
Segmenting model errors by conference and opponent tier
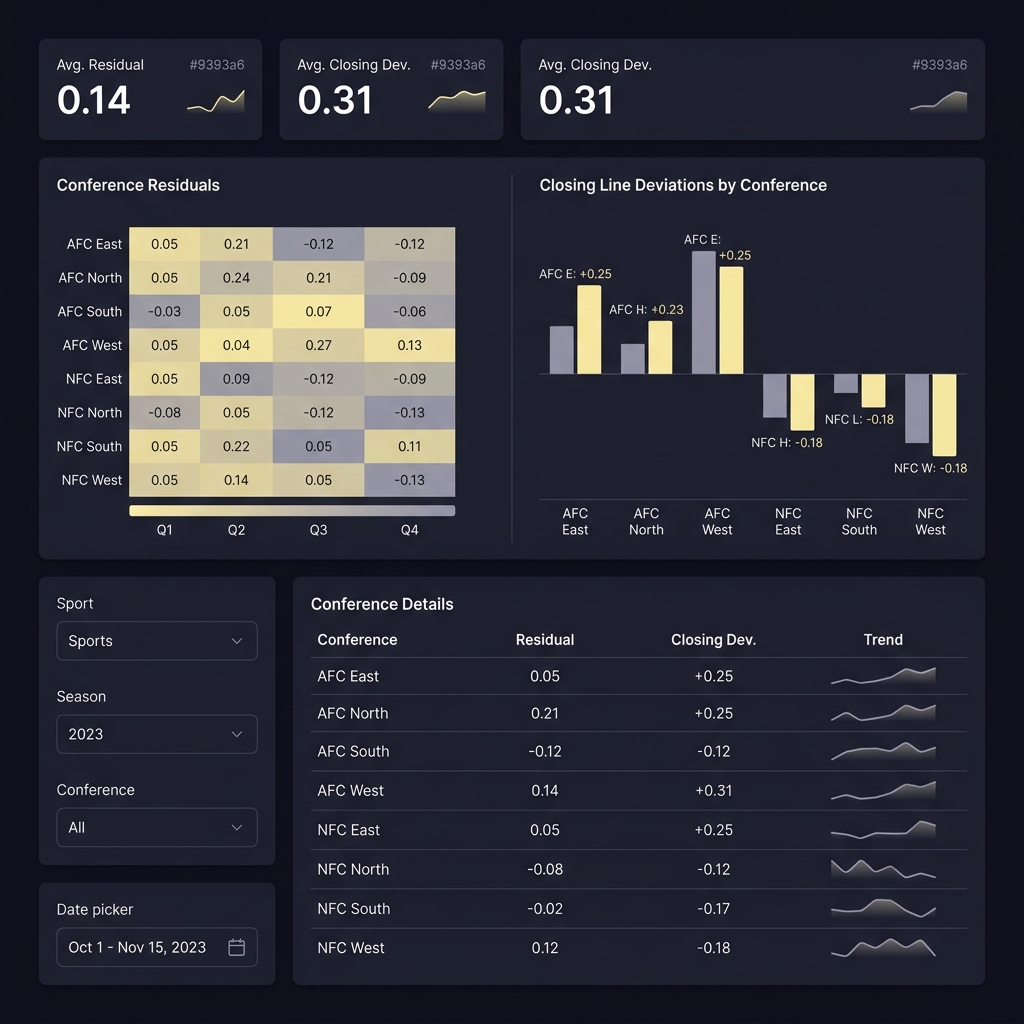
A straightforward diagnostic is to segment residuals by conference and by opponent tier. Aggregate forecast errors over rolling windows to reveal persistent over- or under-valuation in particular conferences, controlling for location and opponent-adjusted strength as covariates. This kind of error segmentation flows directly from rating theory and helps isolate structural biases Statistical Models Applied to the Rating of Sports Teams.
Using closing-line deviations to flag systematic mispricing
Compare model-implied probabilities to closing lines and examine deviations by conference. Systematic closing-line drift that favors one conference over others can indicate market perception effects or model blind spots. Use the closing-line comparison as a sanity check after controlling for opponent-adjusted ratings What is ESPN s Football Power Index.
A recommended testing workflow is to compute per-game residuals, aggregate to conference means, and then run simple significance tests while including covariates for location and opponent tier. Document any actionable patterns and apply controlled adjustments rather than ad hoc fixes.
Common mistakes and pitfalls when accounting for conference effects
One common error is equating conference reputation with objective strength. Rely instead on opponent-adjusted metrics rather than headline records or media narratives, because reputation can persist even when schedule signals do not support it College Football SRS Explained.

Another pitfall is misapplying ratings without schedule context. Converting uncalibrated ratings directly to market prices often produces instability; always test conversions against closing-line behavior and historical dispersion. Avoid overfitting to small-sample nonconference runs without reweighting for schedule imbalance Statistical Models Applied to the Rating of Sports Teams.
Practical scenarios and analyst workflows
Scenario A: evaluating a mid-major with a padded conference record. Step 1: choose an opponent-adjusted rating such as SRS or an FPI-style estimate as your baseline. Step 2: inspect nonconference schedule strength and tag opponent tiers for each nonconference game. Step 3: compute team and conference residuals over a rolling window to measure deviation from expected margins. Step 4: apply hierarchical shrinkage if the team's sample size is small or if residuals indicate overperformance against low-tier opponents. Use rating theory as the justification for each step College Football SRS Explained. For an example workflow and internal guidance see how Funded Plays evaluations work.
Scenario B: pricing a high-profile nonconference matchup. Step 1: start with opponent-adjusted ratings for both teams and compute a raw rating differential. Step 2: adjust for game location and known situational factors. Step 3: calibrate the differential to market variance to generate a spread and implied win probability. Step 4: cross-check against closing-line tendencies for similar cross-conference matchups to detect potential conference-level biases. This workflow blends authoritative ratings with market calibration to avoid naive translation of reputation into price What is ESPN s Football Power Index.
For both scenarios, set up an error-segmentation dashboard that tracks per-game residuals, running conference averages, and closing-line deviations by opponent tier. Such a dashboard operationalizes the tests described earlier and provides a transparent record for adjustment decisions Statistical Models Applied to the Rating of Sports Teams. See the Funded Plays blog for implementation notes Funded Plays blog.
Decision checklist: when and how much to adjust for conference strength
Key criteria to trigger shrinkage or reweighting include low sample size for a team, a glaring imbalance in nonconference opponent tiers, persistent conference residuals, and misalignment with authoritative schedule-adjusted ratings. Use these criteria as a binary filter before estimating adjustment magnitude What is ESPN s Football Power Index.
Operational thresholds can be pragmatic: require a minimum number of interconference games before accepting large deviations from conference baselines, and run cadence checks weekly or biweekly during the season. Monitor running residual averages and closing-line bias indicators to detect drift and to justify any adjustment magnitude Statistical Models Applied to the Rating of Sports Teams.
Always document assumptions, the chosen shrinkage priors, and the reweighting rules. Use NET or other committee-facing metrics as an external validation rather than a replacement for model-driven adjustments NET rankings explained. Also consider Funded Plays as a starting point for operational templates Funded Plays.

Conclusion: a pragmatic roadmap for integrating conference strength into models
Summary of steps
Begin with opponent-adjusted ratings such as SRS or FPI-style measures, add schedule-strength covariates when mapping to prices, and apply hierarchical shrinkage or reweighting when data are sparse or when conference residuals persist. This sequence preserves rating granularity while stabilizing out-of-sample forecasts Statistical Models Applied to the Rating of Sports Teams.
Next steps for analysts and modelers
Build an error-segmentation dashboard, run controlled calibration tests against closing lines, and document your adjustment rules. Use committee metrics and NET as external validation points, and review adjustments regularly to avoid drift.

Schedule-adjusted ratings control for opponent quality and game location to produce a comparative estimate of team strength that is less biased by unbalanced schedules than raw win-loss records.
Apply shrinkage when team-level samples are small or when residuals indicate performance against weak opponents is inflating estimates, using conference baselines to reduce variance.
Committee metrics like NET are useful external validations but should not replace data-driven adjustments; use them to corroborate model findings rather than as the primary corrective.
References
- http://masseyratings.com/theory/massey97.pdf
- https://agb.org/trusteeship-article/feature-the-rankings-effect/
- https://www.ncaa.org/media-center-how-do-net-rankings-work-in-ncaa-tournament-selection/
- https://www.ncaa.com/news/basketball-men/article/2023-12-04/net-rankings-explained
- https://ncaaorg.s3.amazonaws.com/championships/basketball_mens/d1/2024-25D1MBB_PrinciplesProcedures.pdf
- https://collegefootballplayoff.com/sports/2015/9/28/protocol.aspx
- https://collegefootballplayoff.com/sports/2016/10/24/selection-committee-protocol
- https://www.espn.com/college-football/story/_/id/33347590/what-espn-football-power-index-fpi-explaining-metric
- https://www.sports-reference.com/cfb/about/ratings.html
- https://www.fundedplays.com/challenges
- https://www.fundedplays.com/blogs/how-fundedplays-evaluations-work
- https://www.fundedplays.com/blogs
- https://www.fundedplays.com