
Introduction: why comparing conference and non-conference performance matters
Analysts tracking college basketball often see team statistics shift once league play begins. Understanding How Conference Play Changes Team Performance is not a rhetorical exercise; it is a practical problem of attribution: are observed changes the result of true improvement, tougher opponents, travel and rest strain, or venue and tactical adjustments? Early in a season, distinguishing these drivers matters for selection narratives, internal evaluation and roster management, and for consistent long-term forecasting.
This article approaches the comparison task with three central lenses: opponent quality using the NCAA NET and quadrants, venue and home advantage effects, and possession-normalized efficiency measures that account for pace and shot quality. Those lenses, combined with travel and schedule-congestion context, form the evidence base for robust splits and transparent interpretation. For a primer on how NET treats opponent and location, see the NCAA NET explanation NCAA NET explanation. Also see a Yahoo Sports explainer Yahoo Sports.
Download the quadrant-matched splits checklist and spreadsheet
Download the checklist or subscribe to receive the data-ready split template mentioned later to run quadrant-matched comparisons on your own season data.
How the NCAA evaluation framework shapes conference vs non-conference comparisons
The NCAA Evaluation Tool, commonly called NET, combines results, opponent quality and game location to produce rankings that selection committees use in team sheets and résumé assessments. NET quadrants categorize games by opponent quality and venue to weight wins and losses differently when analysts compare results across game types, which is why any split that ignores quadrant balance risks misattribution of performance changes NCAA NET explanation. For the NCAA media center description see How do NET rankings work.
Team sheets package NET results and schedule strength into summary pages the committee reviews when selecting and seeding teams. The committee explicitly looks at résumé quality across both conference and non-conference play, so a conference slate that concentrates quadrant 1 or quadrant 2 games will look stronger on a sheet even if raw scoring averages fall. For an overview of how selection and seeding use these components, see the committee explanation committee explanation.
When comparing conference and non-conference splits, the takeaway is straightforward: control for opponent quality and venue first, because NET and team-sheet constructions are the operational standard evaluators use when judging a team’s résumé.
Why conference schedules tend to look different from non-conference slates
Conferences and individual programs design schedules with different incentives and constraints than non-conference scheduling. League play aims to ensure competitive balance, preserve rivalries, and address travel logistics, which can produce systematic differences in opponent quality compared with carefully curated non-conference slates.
Selection incentives also shape behavior. Conferences may concentrate tougher intra-league matchups or encourage marquee non-conference games to boost collective résumé strength, and those patterns show up in public schedule-strength measures that analysts can use to test whether a split reflects opponent difficulty or a genuine change in team play. For guidance on interpreting pace and scoring differences across game types, consult public game-type splits college basketball game-type splits.

Those institutional and selection-driven incentives mean that many apparent midseason drops or gains in raw statistics are often at least partially explained by who a team is facing and where those games are played.
Travel, rest and schedule congestion: contextual risk factors in conference play
A sizable body of evidence links longer travel and dense scheduling with declines in team performance. Systematic reviews and meta-analysis of transmeridian travel and congested calendars show measurable effects on team sports outcomes, which makes travel and rest variables material covariates in any conference-slate analysis transmeridian travel meta-analysis.
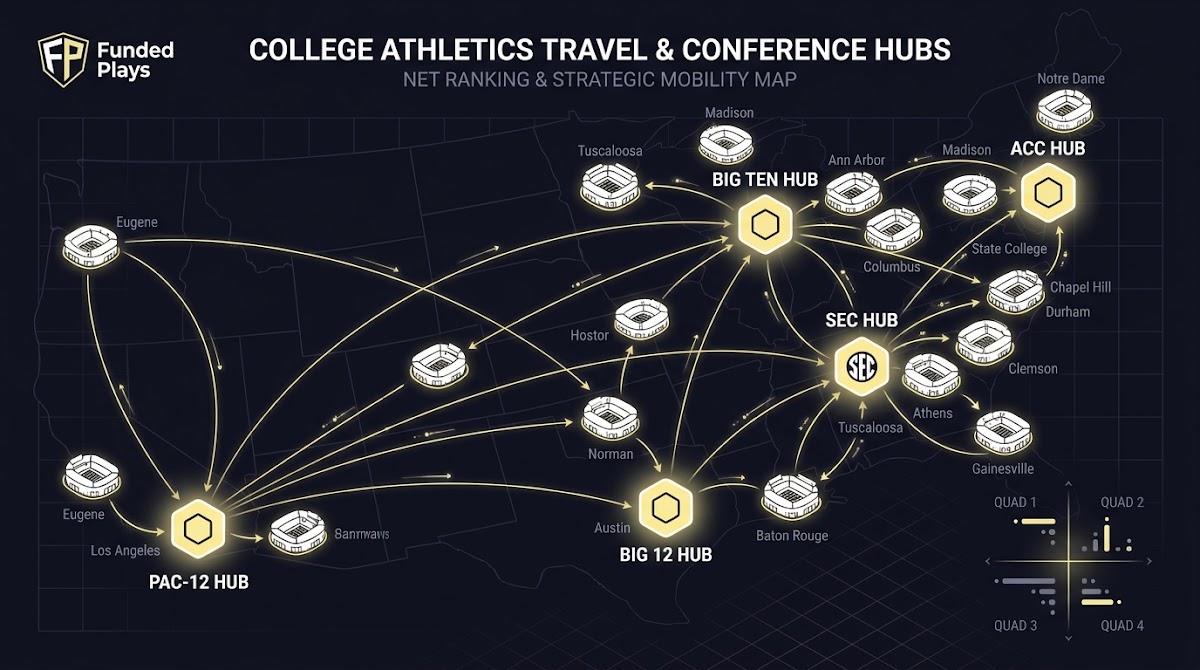
Realignment after 2024 has increased some programs' coast-to-coast travel, turning what were previously local conference trips into multi-time-zone expeditions and amplifying fatigue risk. Analysts should therefore treat unusually long road trips in a league slate as higher-risk observations and explicitly include travel proxies when testing conference versus non-conference performance realignment travel reporting.

Practical travel covariates include aggregate miles traveled across the conference slate, number of time zones crossed per trip, and days between games. These variables are straightforward to compute from publicly available schedules and can be added as controls in regression or matching routines to isolate scheduling burden from on-court performance.
Home advantage and venue familiarity in conference games
Home advantage is a persistent effect across team sports and should be a first-order adjustment when comparing conference and non-conference splits. Updated meta-analytic reviews show consistent home-region advantages tied to crowd, travel and venue familiarity mechanisms that influence outcomes and performance metrics home advantage meta-analysis.
Natural experiments during the COVID-era, when crowd effects were reduced, help validate the proposed mechanisms: venue familiarity and crowd presence explain a measurable portion of home advantage. For analysts, that means splitting conference data by home, away and neutral site and modeling venue as either a fixed effect or a stratifying factor to avoid conflating venue-driven changes with true skill shifts.
Which metrics give the clearest signal: possession-normalized efficiency and shot-quality proxies
Raw points per game or simple scoring averages can be misleading when pace differs between non-conference and conference games. Public splits show that pace and scoring often vary across game types, so possession-normalized measures such as points per 100 possessions yield clearer comparisons college basketball game-type splits.
Recommended metrics include offensive rating and defensive rating on a per-100-possessions basis, effective field goal percentage, turnover rate, offensive rebounding rate and simple shot-quality proxies like three-point attempt share and free-throw rate. When possible, compute lineup-level aggregates to detect whether personnel usage shifts in conference play and whether efficiency variation is driven by lineups rather than a wholesale team change.

Present splits as adjusted efficiencies: report per-100-possessions values, include opponent quadrant or NET as an adjustment, and show home and away splits. That presentation lets readers see whether a lower scoring average in conference play is due to slower tempo, tougher defense, or both. See the Funded Plays blog for related templates Funded Plays blog.
Adjusting for opponent quality: using NET quadrants and team-sheet components
To control for opponent quality, the simplest robust approach is quadrant matching. Compare conference and non-conference games that fall into the same NET quadrant, or weight game outcomes by quadrant frequency, to avoid conflating tougher opponents with performance decline. The NET quadrant framework is the operational standard for this type of adjustment so it is a natural starting point for reproducible splits NCAA NET explanation. See quad-wins context at bballnet.
Regression approaches are complementary: include opponent NET, game location indicators, and possessions as covariates to estimate whether the conference/non-conference indicator remains significant after controls. Be cautious about small-sample bias when there are few quadrant 1 or 2 games in either split, and report confidence intervals or bootstrap results to indicate robustness.
Compute quadrant-matched splits and regression controls
Use consistent quadrant codes when matching
When matching by quadrant, require a minimum number of matched games before declaring a persistent difference. If a team has only one or two quadrant 1 games in conference play, any split that hinges on those games will be noisy; match or weight to avoid misleading conclusions.
Modeling the effects of post-2024 realignment on conference travel
Quantify travel burden across a conference slate with straightforward aggregates: total miles traveled for conference road games, cumulative time zones crossed, and average days off between conference contests. Those measures convert schedule footprints into numeric covariates that can be included in regressions or matched comparisons to test whether travel explains observed dips in efficiency realignment travel reporting.
Treat coast-to-coast trips as higher-risk observations: flag them in your dataset, test for interaction effects with days off, and consider sensitivity checks that exclude extreme travel instances to verify whether an effect is robust to those outliers. When comparing seasons across realignment, document schedule changes explicitly so that any cross-season comparison is transparent.

Tactical and behavioral differences in conference play coaches exploit
Coaches frequently change emphasis in conference play as scouting familiarity rises. Common tactical shifts include a slower tempo, more focus on halfcourt defense, and targeted game plans to exploit opponent weaknesses; those changes can manifest as lower team pace, increased turnover pressure, or altered three-point attempt share compared with early-season games.
Analysts can detect tactical adjustments with signals such as consistent shifts in offensive rebounding rate, turnover rate, and three-point attempt share across the conference slate. When you see persistent lineup-level changes, verify those in video or scouting reports before attributing differences to coaching rather than random variation.
Typical analyst mistakes and how to avoid them
A common error is treating raw point changes as evidence of true skill change without adjusting for opponent quality and pace. A lower scoring average in conference play may simply reflect slower tempo or stiffer defense, not an erosion of talent. Use possession-normalized metrics and quadrant matching to reduce this mistake college basketball game-type splits.
Another pitfall is over-interpreting early conference splits with small samples. Guard against this by requiring robustness across multiple measures and by using bootstrap or permutation tests to assess whether observed differences exceed sampling noise. Finally, do not ignore travel and rest; systematic reviews link schedule congestion and travel burden to performance outcomes, so include those covariates where relevant transmeridian travel meta-analysis.
A practical, step-by-step analyst workflow for comparing conference and non-conference performance
Data collection and cleaning: gather game-level data for the season including date, opponent, location, NET at time of game or end-of-season NET, possessions, boxscore metrics (FG, 3PT, FT, rebounds, turnovers), and travel proxies (distance, time zones crossed, days since last game). Ensure consistent quadrant coding and fill missing possessions with a standard possessions estimator when necessary.
Analysis sequence: 1) compute per-100-possessions offensive and defensive ratings; 2) stratify or match games by NET quadrant; 3) run regressions with opponent NET, location dummies and travel/rest covariates; 4) check robustness with bootstrap intervals and sensitivity tests that remove extreme travel trips or a single outlier opponent NCAA NET explanation.
Interpretation checks: require that any claimed performance shift is consistent across multiple metrics, that quadrant controls do not erase the effect, and that travel/rest variance is not a simpler explanation. Keep a transparent log of adjustments and share the cleaned dataset and code when possible so others can reproduce the split. See our evaluation post how Funded Plays evaluations work.
Example scenarios and a template case study for analysts
Scenario A, a mid-major with a light non-conference slate: the team posts high scoring averages early against weaker opponents. After conference play begins, scoring and pace decline. The analyst should match conference games to non-conference opponents by NET quadrant; often the apparent decline diminishes or disappears once stronger opponent quality is controlled.
Scenario B, a power-conference team facing more travel after realignment: the team shows dips in second-half efficiency on road trips. The analyst should compute aggregate travel metrics for the conference slate and test whether efficiency dips correlate with cumulative miles or time zones crossed. Sensitivity tests that exclude extreme coast-to-coast trips help determine whether travel is the primary driver or an amplifying factor realignment travel reporting.
What coaches, analysts and selection committees should watch midseason
Midseason, stakeholders should monitor whether shifts in performance persist after quadrant and pace adjustments. Early warning signs that splits are schedule-driven include sudden increases in quadrant 1 opponent frequency or a cluster of long travel blocks that align with efficiency dips. Keep these signals documented for selection narratives and internal reports committee explanation.
Operational responses include adjusting travel plans where possible, adding recovery days, and focusing scouting resources on the most informative opponents rather than reacting to noisy early-slate splits. Transparent logs of schedule anomalies and their modeled impacts strengthen any midseason argument about a team’s trajectory.
Conclusion: practical takeaways and a checklist to use after reading
Three practical takeaways: first, NET quadrants and team-sheet concepts should be the baseline controls when comparing splits; second, home advantage and travel/rest are material contextual factors; third, possession-normalized efficiency metrics provide the clearest signal when pace varies between splits NCAA NET explanation.
Before declaring a true conference-driven performance change, run these three checks: quadrant-matched efficiency comparisons, travel/rest covariate tests, and home/away stratified analyses. These reproducible steps help separate schedule artifacts from real team development and support evidence-based narratives for selection and coaching decisions. For additional resources visit Funded Plays.
Use NET quadrant matching or regression controls that include opponent NET and location indicators to compare like-for-like games and reduce bias from stronger opponents.
Yes; meta-analytic evidence links longer travel and schedule congestion to performance declines, so include travel distance and days off as covariates when testing splits.
Possession-normalized offensive and defensive ratings, effective field goal percentage, turnover rate and lineup-level efficiency aggregates are recommended.
References
- https://www.ncaa.com/news/basketball-men/article/2023-11-08/net-rankings-explained
- https://sports.yahoo.com/articles/net-rankings-explained-ncaa-tournament-190038727.html
- https://www.ncaa.org/media-center-how-do-net-rankings-work-in-ncaa-tournament-selection/
- https://www.ncaa.com/news/basketball-men/article/2024-03-12/how-the-committee-selects-and-seeds-the-ncaa-tournament-teams
- https://www.teamrankings.com/ncaa-basketball/stat/points-per-game
- https://sportsmedicine-open.springeropen.com/articles/10.1186/s40798-024-00620-1
- https://www.washingtonpost.com/sports/2024/08/29/college-sports-realignment-travel-distances/
- https://www.frontiersin.org/articles/10.3389/fpsyg.2024.00000/full
- https://www.fundedplays.com/challenges
- https://www.fundedplays.com/blogs
- https://bballnet.com/
- https://www.fundedplays.com/blogs/how-fundedplays-evaluations-work
- https://www.fundedplays.com