
How Calibration Improves Sports Forecasts, definition and why it matters
Calibration means that a predicted probability matches the long-run frequency of the event under identical conditions. For example, if a forecaster repeatedly assigns a 60 percent chance to similar game outcomes, those events should happen about 60 percent of the time. That alignment between predicted probability and observed frequency is the core of probability calibration, and it is distinct from simple hit rate or ranking metrics.
One of the reasons calibration matters is that it is directly tied to decision quality when users act on probabilities rather than binary predictions. A probability that is well calibrated allows a coach, bettor, or analytics user to pick thresholds that match their risk tolerance. Proper scoring rules help quantify this quality. The Brier score is a strictly proper scoring rule and its decomposition into reliability, resolution, and uncertainty gives a diagnostic view of where a model is miscalibrated and what it does well Statistical Science review on proper scoring rules.
Calibration is important even when overall accuracy, AUC, or rank ordering stay the same. A model can preserve ranking while changing the expressed probabilities in ways that improve or harm decisions based on those probabilities. In short, calibration improves the practical usefulness and trustworthiness of probabilistic forecasts without necessarily changing headline accuracy numbers.
Calibration is not a guarantee of profit or correct single-game calls. It improves probability quality over many similar cases, and it must be validated out of sample to ensure apparent gains are not due to leakage or overfitting.
Choose an open source plotting or calibration library for diagnostics
pick libraries with training and plotting examples
What probability calibration means in forecasting
Probability calibration answers the question: when I say X percent, how often does X occur? That clarity matters in sports contexts where decisions are based on expected values or risk thresholds. For example, a fantasy manager deciding whether to start a player will weigh a 55 percent chance of a points target differently if that 55 percent is trustworthy.
Practically, calibration looks at predicted probabilities across many similar events and compares them to observed frequencies. The comparison produces a reliability check rather than a single accuracy figure.
How calibrated probabilities affect decision quality and trust
Well calibrated probabilities make threshold decisions more defensible and consistent. If users trust the probability scale, they can set systematic rules, such as staking rules or selection cutoffs, with clearer expectations about outcomes. That trust also improves transparency when models are shared with teammates or community users.
Finally, a calibrated system supports fair comparison across time and models, because the probabilities are on the same frequency-aligned scale, which helps analytics teams evaluate changes to models without conflating ranking and probability scale.
How Calibration Improves Sports Forecasts, core diagnostics and scores to use
Brier score decomposition: reliability, resolution, uncertainty
The Brier score measures the mean squared difference between predicted probability and the event outcome. It is decomposable into three intuitively useful parts: reliability, which captures calibration error; resolution, which captures the model's ability to separate events from non-events; and uncertainty, which depends only on the event base rate. Using decomposition helps practitioners see whether a poor Brier score comes from bad calibration or from a lack of signal to separate outcomes Quarterly Journal article on reliability and score decomposition. For practical implementations see the scikit-learn calibration module.
When applying Brier decomposition in sports, compute components on validation or test splits so you can compare raw and recalibrated forecasts without leakage. Improving reliability while preserving or increasing resolution is the goal; if reliability falls but resolution also drops, recalibration may have harmed discriminative power.

Reliability diagrams for visual checks
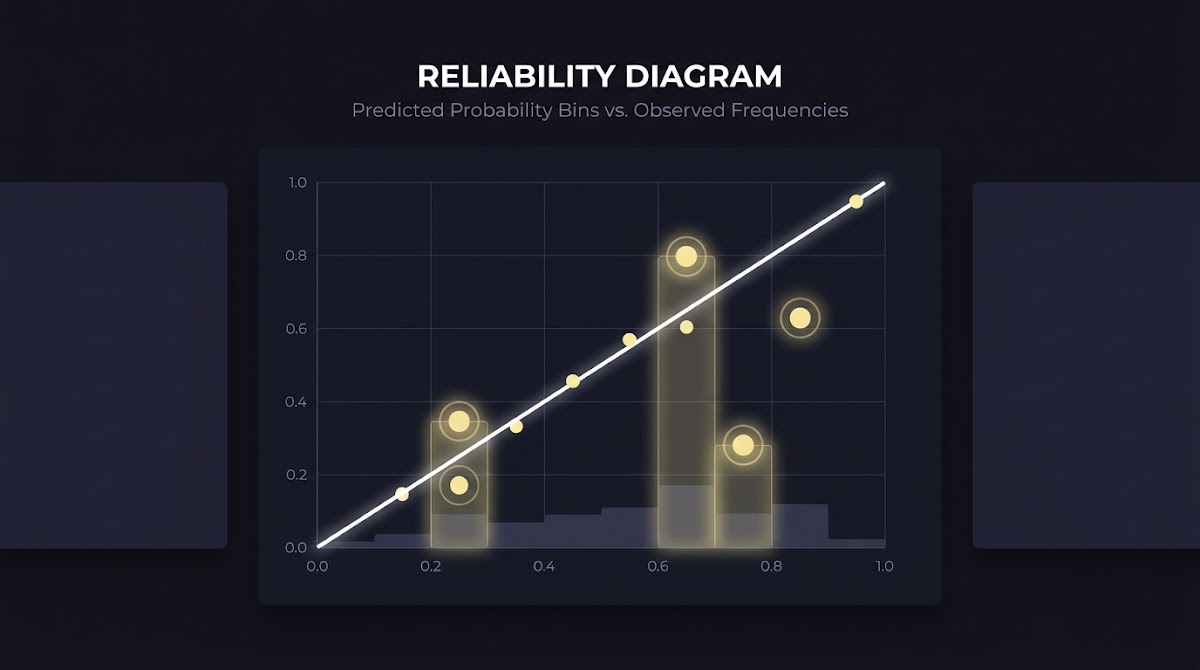
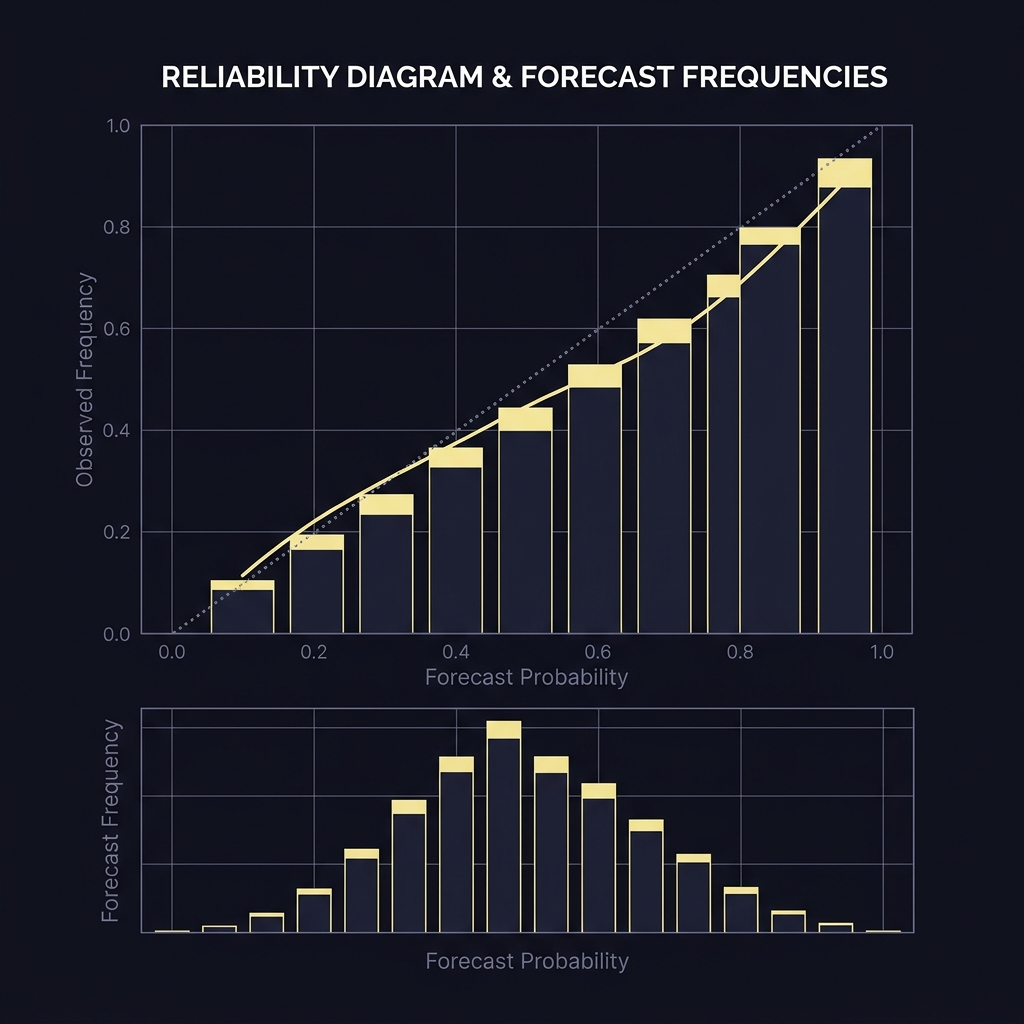
Reliability diagrams, also called attributes diagrams, group forecasts into probability bins and plot the average predicted probability versus the observed frequency in each bin. A perfectly calibrated model lies on the diagonal line; deviations show where the model under- or overestimates probability. These plots are especially helpful in sports because they reveal whether miscalibration is uniform or concentrated at certain probability ranges, like near 50 percent or in the tails Quarterly Journal article on reliability and score decomposition.
For sports forecasts, choose bins that reflect decision-relevant ranges. Finer bins show more detail but require more data per bin. Pair the plot with marginal histograms of forecast frequency to see where data are thin.
Expected Calibration Error (ECE): summary measure and limits
Expected Calibration Error computes the weighted average gap between predicted probability and empirical frequency across bins. It is a convenient scalar summary of miscalibration, but its value depends on the binning scheme. Different bin counts or adaptive bin boundaries produce different ECE values, so ECE should not be used alone to claim improvements AAAI paper on Bayesian binning and ECE issues.
Best practice is to use ECE as a quick check, accompanied by reliability diagrams and proper scores like the Brier score to understand the practical significance of any change. When tuning binning, keep the same binning for before-and-after comparisons to avoid creating apparent gains from changing the summarization method.
Common recalibration methods and their trade-offs
Platt scaling and isotonic regression
Platt scaling fits a sigmoid mapping from model scores or logits to probabilities; it is parametric and compact, which makes it robust in smaller calibration samples. Isotonic regression fits a monotonic nonparametric mapping, which is more flexible and can correct more complex distortions but risks overfitting when the calibration set is small ICML paper on predicting good probabilities.
In sports forecasting, Platt scaling is often a sensible first test when calibration data are limited. Isotonic regression is valuable when you have ample out-of-sample calibration data and you suspect non-monotonic distortions in probability scaling.
Use a held-out calibration set separate from training, fit simple parametric methods first, evaluate with Brier decomposition, ECE, and reliability diagrams on an untouched test set, and monitor rolling metrics to detect drift.
Temperature scaling and beta calibration
Temperature scaling rescales logits with a single temperature parameter, changing probability sharpness while preserving rank ordering. Because it acts on logits, it typically leaves classifier accuracy and AUC unchanged while improving calibration in many cases ICML study on calibration of modern neural networks. A deeper practical read is available in a deep dive.
Beta calibration generalizes simple mappings with a two-parameter beta-based transform and is designed to handle skew and asymmetric distortions in probability distributions. It can be more flexible than Platt scaling but remains more structured than isotonic regression, which gives it a middle-ground bias-variance profile JMLR article on beta calibration.
Flexibility versus overfitting: practical guidance
Simpler parametric methods like Platt or temperature scaling reduce variance and are preferable when calibration samples are small or when you want to preserve ranking. More flexible methods like isotonic regression can fix nuanced miscalibration but need larger calibration sets and careful cross-validation to avoid fitting noise.
Always assess recalibration on held-out data. If isotonic regression shows big improvements on the calibration split but not on the test split, that is a warning sign of overfitting and a reason to prefer simpler transforms.
Practical recalibration workflow for sports forecasting
Data splits: training, calibration, and test sets
A safe workflow separates model training data from a held-out calibration set and a final test set. Train the base model without seeing the calibration set; fit the recalibration mapping on the calibration set only; and then evaluate the recalibrated probabilities on the test set to measure true out-of-sample gains. This split prevents leakage and gives a clearer picture of real improvements ICML study on calibration of modern neural networks.
For time-ordered sports data, use time-based splits: train on earlier seasons or weeks, reserve a contiguous calibration block, and test on a subsequent period to mimic deployment conditions and guard against season-to-season non-stationarity.
Fitting calibration on held-out data to avoid leakage
Fit calibration only on the designated calibration split. Do not mix calibration examples back into model training or hyperparameter tuning unless you use nested cross-validation that preserves an outer test. Leakage between stages produces optimistic calibration estimates that will not hold in real deployment.
If you have limited data, consider cross-validation strategies that create multiple calibration folds, but always keep a final untouched test period for honest evaluation.
Evaluating recalibration with out-of-sample diagnostics
Evaluate recalibration using the full toolbox: Brier score and decomposition to see reliability change, ECE with fixed binning for a scalar check, and reliability diagrams to spot where improvements occur. Compare both raw and recalibrated outputs on the same test set and verify that resolution was not sacrificed for apparent reliability gains Statistical Science review on proper scoring rules.
Keep notes on sample sizes, binning choices, and the exact calibration procedure so results are reproducible and auditable by other analysts. For implementation-oriented examples see this Kaggle tutorial.
Decision criteria: choosing methods and sizing calibration sets
When to choose parametric versus nonparametric recalibration
If the calibration set is small or you want to preserve ranking, start with parametric methods such as Platt scaling or temperature scaling. These methods are low-variance and often sufficient to correct mild systematic bias. If you have a large calibration set and expect complex distortions, isotonic regression or beta calibration can capture them more fully ICML paper on predicting good probabilities.
If you observe that a parametric fit leaves structured residuals in a reliability diagram, that is a cue to try a more flexible method, but validate that flexibility on out-of-sample data.
Test recalibration on a held-out season
Try this decision checklist on a held-out season split before applying recalibration in production
Sample size and overfitting trade-offs
As a rule of thumb, nonparametric isotonic fits need substantially more calibration examples to avoid overfitting. When sample sizes are low, isotonic curves can produce step-like mappings that reflect noise, so prefer parametric fits or pooled binning in those cases.
If you must use isotonic regression on limited data, apply monotonicity constraints, combine adjacent bins for stability, or regularize the mapping by smoothing to reduce variance.
Sports-specific factors that influence choices
Sports with sparse or highly seasonal data, like niche leagues or early-season matchups, favor conservative recalibration choices and rolling recalibration windows. Sports with dense data, such as daily matches or large pooled tournaments, permit more flexible mappings and finer-grained bins.
When in doubt, favor methods that generalize better in your sport and validate using season-to-season holdouts to account for non-stationarity ICML study on calibration of modern neural networks.
Typical errors and pitfalls to avoid
Leakage and validation mistakes
One common mistake is fitting recalibration using data that influenced the base model or hyperparameter tuning. That leakage creates an illusion of perfect calibration in validation but collapses in production. Always reserve a final test period that has never influenced training or calibration.
Another error is using cross-validation without preserving time order in time series forecasts; shuffling time blocks can leak future information backward and inflate apparent calibration.
Overreliance on ECE or single metrics
ECE is a useful summary but can be misleading because it depends on binning choices. Using ECE alone can hide localized miscalibration. Combine ECE with reliability diagrams and proper scores so you see both the scalar summary and the detailed distributional errors AAAI paper on Bayesian binning and ECE issues.
Also watch for cases where ECE improves but resolution drops. That pattern indicates a smoothing or shrinking of probabilities that reduces discrimination even as average calibration improves.
Ignoring seasonality and drift
Sports data change across seasons, rule changes, and player turnover. A recalibration fitted on one era may not hold in the next. Monitor rolling calibration metrics and consider retraining or rolling recalibration schedules to respond to drift.
Practical checks include watching rolling Brier scores and plotting sequential reliability diagrams to spot gradual shifts in calibration quality ICML study on calibration of modern neural networks.
Practical examples and scenarios
Recalibrating preseason model across a season
Example workflow: train your preseason model on prior seasons, hold out the first six to eight weeks of the new season as a calibration block, fit Platt scaling and isotonic regression on that block, then test both recalibrations on the remaining season. Compare Brier decomposition and reliability diagrams on the test set to decide which mapping generalizes.
In this scenario, Platt may win with small calibration blocks, while isotonic typically needs a larger calibration period to show reliable gains. Use fixed binning for ECE comparisons so numbers are comparable across methods ICML paper on predicting good probabilities.
Comparing raw and recalibrated forecasts in a tournament setting
In short tournaments with many independent games, pool similar game types and use pooled calibration to increase sample size. Fit temperature scaling if you only need sharper or softer probabilities without changing rankings, and use isotonic regression if you have enough pooled samples to support a nonparametric fit ICML study on calibration of modern neural networks.
Always report both resolution and reliability components of the Brier decomposition so readers understand whether recalibration improved calibration, discrimination, or both.

Short checklist for applied sports analysts
Checklist: 1) Reserve a calibration block separate from model training, 2) Try Platt and temperature scaling first, 3) Try isotonic if you have enough calibration data, 4) Evaluate on a final test set with Brier decomposition, ECE using fixed bins, and reliability diagrams, 5) Monitor rolling metrics for drift.
These steps help keep recalibration reproducible and honest, and they allow you to compare mappings transparently across seasons and sports. See the Funded Plays blog for related posts.
Monitoring calibration over time and maintenance practices
When to retrain or recalibrate
Retrain base models or refit calibration when out-of-sample Brier reliability or ECE degrades beyond a practical threshold for your application. The exact trigger depends on how sensitive your decisions are to probability errors and on the volume of new data available ICML study on calibration of modern neural networks.
For many sports workflows, a seasonal recalibration cadence or an event-driven retrain after rule or lineup changes is a sensible compromise between responsiveness and overfitting.
Automated checks and drift alerts
Build automated daily or weekly checks that compute rolling Brier scores, ECE with a fixed binning, and produce a reliability diagram snapshot. Set alerts when reliability or ECE drifts past established thresholds so analysts can investigate causes rather than discover issues after decisions have been made.
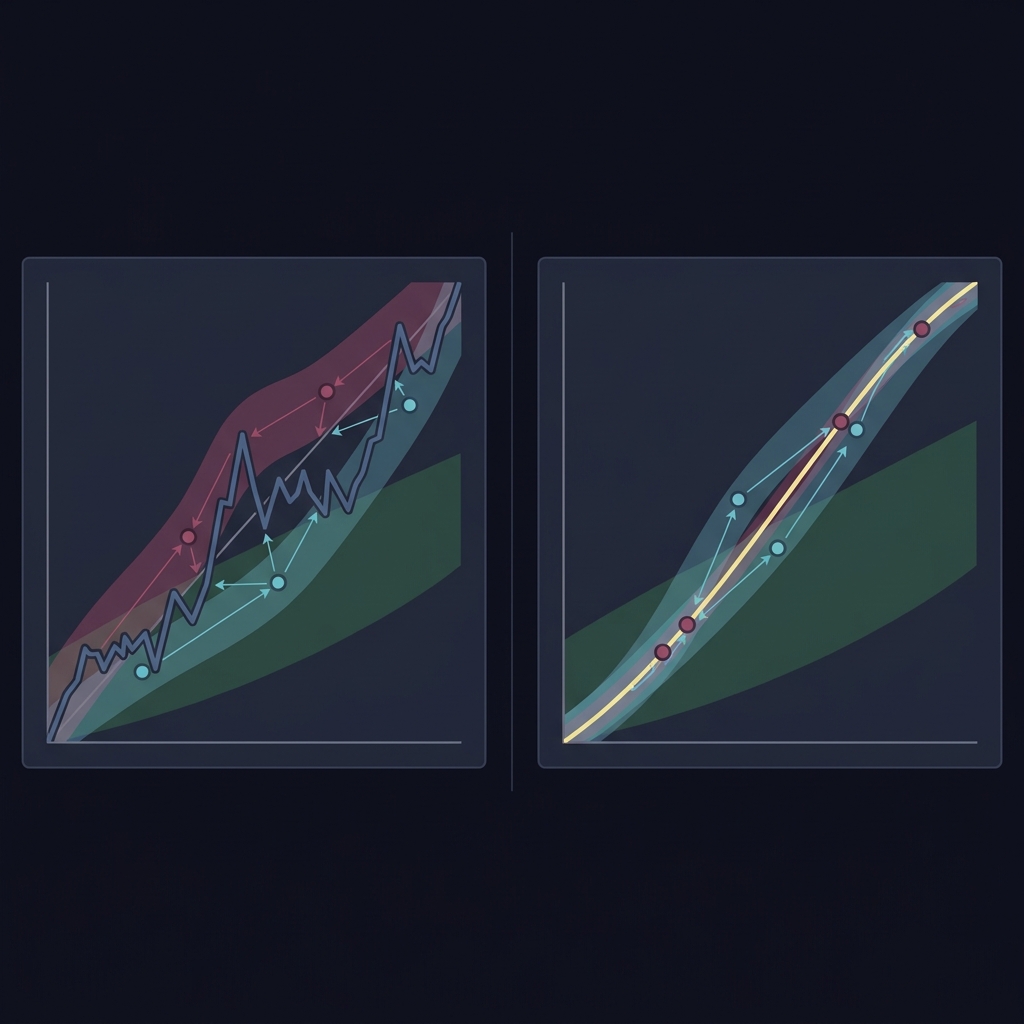
Automated checks should also track where in the probability range the drift occurs, because fixes differ if only tail probabilities shift versus a broad-based calibration shift.
Long-term tracking metrics
Keep a calibration log with rolling Brier components, ECE, and representative reliability plots. Over time this record helps you see gradual changes, evaluate the impact of model updates, and choose when to prefer parametric or nonparametric recalibration strategies.
Document binning choices and evaluation windows so that historical comparisons are meaningful and not confounded by changing diagnostics.
Conclusion: practical next steps for sports forecasters
Calibration matters because it aligns predicted probabilities with observed frequencies, improving decision quality, transparency, and trust. Use the Brier score and its decomposition, reliability diagrams, and ECE together to diagnose and measure calibration changes Statistical Science review on proper scoring rules. Visit Funded Plays for more on our work.
Action plan: reserve a calibration set, plot reliability diagrams, compute Brier decomposition, try Platt and temperature scaling, and consider isotonic or beta calibration when you have sufficient calibration samples. Validate all changes on a final out-of-sample test set and monitor rolling metrics for drift.
Calibration is the alignment between predicted probabilities and observed event frequencies, so a stated probability reflects real-world outcomes over many similar cases.
Use isotonic regression when you have a sizable calibration set and suspect complex, monotonic distortions; avoid it for very small calibration samples due to overfitting risk.
Some methods like temperature scaling preserve ranking and typically leave AUC unchanged, while other transforms can alter rankings depending on their flexibility.
References
- https://projecteuclid.org/journals/statistical-science/volume-22/issue-3/Strictly-Proper-Scoring-Rules-Prediction-and-Estimation/10.1214/07-STS243.full
- https://rmets.onlinelibrary.wiley.com/doi/10.1002/qj.456
- https://ojs.aaai.org/index.php/AAAI/article/view/9602
- https://www.cs.cornell.edu/~alexn/papers/calibration.icml05.crc.rev3.pdf
- https://arxiv.org/abs/1706.04599
- https://www.jmlr.org/papers/v19/17-777.html
- https://www.fundedplays.com/challenges
- https://scikit-learn.org/stable/modules/calibration.html
- https://www.kaggle.com/code/kelixirr/probability-calibration-tutorial
- https://www.kdnuggets.com/a-deep-dive-into-calibration-of-language-models-platt-scaling-isotonic-regression-temperature-scaling
- https://www.fundedplays.com
- https://www.fundedplays.com/blogs
- https://www.fundedplays.com/blogs/how-fundedplays-evaluations-work