
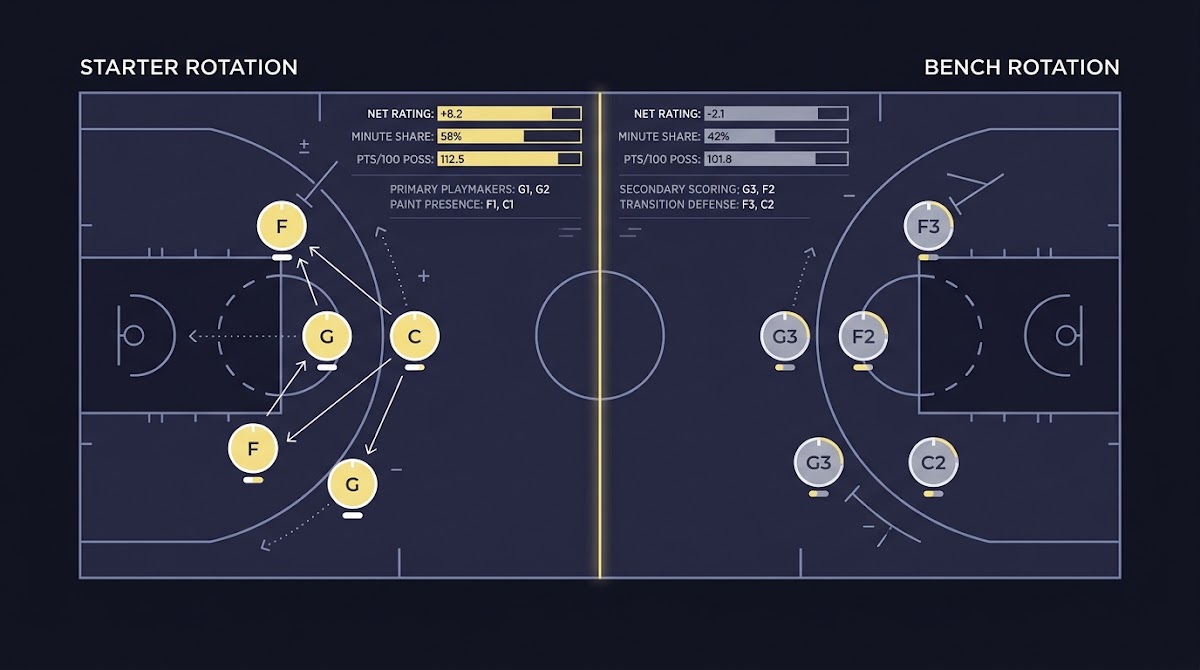
What 'bench depth' means and why it matters for markets
How Bench Depth Affects Regular-Season Markets
Bench depth refers to the combined contribution of a team s reserve players measured across minutes, production, and efficiency rather than a single raw counting stat. Framing it this way makes bench depth actionable for modelers because it ties minutes and per-possession performance to how many points a team can expect when starters rest or are unavailable. This distinction matters because markets price expected team strength for a given game window, not season-long totals.
Operationally, modelers use starter versus bench splits and minute shares to define bench depth. NBA.com/Stats provides starter and bench filters that expose Net Rating and Pace for reserve units, which lets you measure how a bench unit performs on a per-100-possessions basis rather than using raw bench points alone NBA.com/Stats glossary and filters.

Operationalizing bench depth: minutes, production, efficiency
Start with minutes: who gets the second-unit minutes when a starter sits, and how many of those minutes are available in the likely rotation? Minutes convert to opportunity; reserve scoring and defense per 100 possessions convert opportunity into expected margin. By combining minutes with Net Rating splits you convert availability into a projected net impact that the market cares about.
Bench scoring per game is easy to track but incomplete. Daily tracking services report bench points per game, yet those numbers must be contextualized by minutes and efficiency to avoid overstating reserve value TeamRankings bench points per game tracker.
Market channels: spreads, totals, and live lines
Reserve-unit strength influences three primary market levers. First, the spread moves when a team s expected margin changes because reserves replace starters who would otherwise carry a different net rating. Second, totals adjust when bench units materially affect pace or offensive efficiency. Third, live lines are often most sensitive because late availability news compresses the market window for updating minute-share assumptions.
Market responses are typically driven by rotation news, rest declarations, and injury reports rather than season aggregates alone. When a rotation change is credible, books map that information into minute-share forecasts and then into a unit-level rating before adjusting lines.
How and when bench changes move regular-season betting lines
Typical triggers: injuries, rest policies, back-to-backs
Bench-driven line moves most often follow a small set of triggers: an injury to a starter, a coach s rest decision under the league s participation norms, and intense schedule spots such as back-to-backs. Those events increase reserve minutes and make bench depth immediately material to the expected game outcome.
Books and market makers convert these triggers into projected minute shares and then recompute team strength using starter and reserve unit ratings. In practice this means availability reports feed a minute-share mapping that adjusts team-level Net Rating ahead of a line change NBA.com/Stats bench filter for team advanced metrics.
Map the missing starter s minutes into reserve minute shares, recompute the weighted team rating using starter and bench Net Ratings or aggregated EPM values, then simulate the margin and size exposure proportionally to the model s confidence.
When a star is ruled out on game day, the market s task is to translate that announcement into minutes for the next-best options and then into a revised spread within minutes.
Market sensitivity: spreads vs totals
Spreads are directly about expected margin, so a weak reserve unit compared with a missing starter usually shifts the spread more than the total. Totals change when the reserve unit alters pace or offensive efficiency in a predictable way. Live in-play lines can swing fastest because they must incorporate both updated minute shares and in-game usage shifts simultaneously.
As a rule of thumb, small rotations where a single reserve can maintain per-possession efficiency tend to move totals less, while rotations that reduce offensive efficiency or increase pace variance tend to widen market movement on both spreads and totals.
Primary data sources and metrics for bench analysis
Starter vs Bench filters on NBA.com/Stats
If you are building bench-aware models, start with the Starter and Bench filters on NBA.com/Stats to capture unit-level Net Rating, offensive rating, defensive rating, and pace. These filters provide up-to-date team unit splits for the current regular season, making them a practical first stop when calibrating rotation adjustments NBA.com/Stats glossary and filters.
Season-level splits from Basketball-Reference and daily tracking sources
Use Basketball-Reference season starters and reserves summaries as a season benchmark to understand how a team s bench minutes and scoring have trended across the year. Those season summaries are useful for framing expectations when daily minute allocations look within historical norms Basketball-Reference starters and reserves season summaries.
For game-day decisions you also want daily trackers that report bench scoring and rotations. These sources help spot short-term shifts that would not be visible in season aggregates and provide the inputs needed to map availability into minute-share forecasts TeamRankings bench points per game tracker.
A practical framework: converting bench splits into model adjustments
Unit-based approach: Starter unit vs reserve unit strengths
Frame each team as a weighted average of starter-unit strength and reserve-unit strength where weights are projected minute shares for the expected game window. The simplest formula is: expected team rating = starter net rating * starter minute share + bench net rating * bench minute share. That yields an adjusted team rating that reflects which unit will play the minutes that matter for a given matchup.

Begin by pulling the Starter/Bench Net Ratings from your data source and a best-guess minute-share distribution based on the availability report and typical rotation patterns. This weighted approach converts readily into spread adjustments because Net Rating differences directly map to expected points per 100 possessions.
Translating EPM and plus-minus into lineup-level value
When you need player-level resolution, Estimated Plus-Minus and related plus-minus metrics provide a method to move from individual impact to bench-unit value. Aggregating reserve players EPM values and reweighting them by expected minutes gives a proxy for the reserve unit s per-100 possession impact that you can use in simulations Estimated Plus-Minus methodology overview.
Use EPM aggregation carefully: it is best paired with unit-level Net Rating checks so that aggregated player impacts align with observed bench performances. Once you have a reserve-unit estimate, plug it back into the weighted team rating and run a lineup-level simulation to produce a projected margin and total.
Quick set of data endpoints to pull starter vs bench splits
Refresh daily for game-day checks
Decision criteria: when to treat bench depth as a material model input
Thresholds and rules of thumb
Set simple thresholds so you only apply bench adjustments when they matter. A practical rule is to trigger a bench-adjustment workflow when projected bench minute share changes by more than 8 to 12 minutes for a single starter s minutes in the core rotation window. That shift is typically large enough to alter per-game expectations.
Another rule of thumb is to apply bench adjustments when the starter-versus-reserve Net Rating gap exceeds a moderate threshold and the starter is expected to miss a significant share of minutes. In those cases the weighted team rating materially diverges from the season average and warrants a line update NBA.com/Stats bench filter for unit ratings.
Which matchups amplify bench effects
Bench impact is magnified in matchups where one team relies heavily on starters while the opponent has deeper rotation balance, or when a team s defensive identity changes sharply with reserves on the floor. Schedule density and travel can also magnify the effect because they raise the probability that starters rest or are limited.
When you see consecutive games, long travel across time zones, or national TV scheduling that encourages load management, increase the sensitivity of your minute-share model so the probability-weighted adjustments reflect higher bench usage.
Placing product context: where a funded prediction challenge adds value
Using simulation challenges to test bench-adjusted models
Validated simulation environments let you run bench-adjusted strategies without exposing real capital. A structured challenge or virtual funded account gives a reproducible workflow for testing sensitivity to minute-share assumptions and for comparing lineup-level approaches over a long sample.
These challenge-style simulations use virtual bankrolls and evaluation rules to measure consistency and decision quality rather than financial risk, making them suitable for iterative model development and for validating whether bench-based adjustments produce repeatable edges before live deployment Basketball-Reference starters and reserves summaries.

Safe, rules-based testing versus real-money experimentation
Keep testing disciplined: define acceptance thresholds, run blinded out-of-sample tests, and measure both PnL-like metrics and decision-quality metrics such as hit rate and calibration. That process helps identify when bench-adjusted models are robust to rotation noise versus when they overfit to idiosyncratic lineup patterns.
Common modeling mistakes and how to avoid them
Over-relying on bench points per game
One of the most common errors is treating bench points per game as a proxy for reserve strength without accounting for minutes and efficiency. Bench points can rise because a team plays faster or because reserves soak garbage-time minutes, neither of which equates to equal per-possession value against quality opponents TeamRankings bench points per game tracker.
A safer alternative is to normalize bench production on a per-100-possessions basis and to merge that with minute-share forecasts so the model predicts margin impact rather than raw scoring changes.
Ignoring minutes volatility and lineup context
Season averages hide short-term volatility. Late scratches and temporary role changes can produce minute-share swings that materially alter outcomes in the next one to three games. Validate any bench-based adjustment by backtesting on historical rotation changes and by checking whether lineup-level predictions match observed plus-minus shifts EPM methodology overview.
Maintain an audit trail of minute-share changes and lineup assumptions so you can trace model revisions and avoid silent drift caused by ad-hoc adjustments.
How late scratches, rest, and back-to-backs change live lines
Real-time signals to watch on game day
On game day the clearest signals are official participation reports, coach comments in pregame media, and credible injury updates that specify expected minutes or game plan changes. Those signals should trigger an immediate minute-share mapping and a rapid recomputation of the weighted team rating.
Check the participation report for any late-out designations or limited practice notes.
Monitor coach or team staff comments that clarify rotation intent.
Watch pregame warmup photos and early usage indicators to confirm minute-share expectations.
After you run these checks, update your minute-share projection and the weighted team rating; if the change crosses your action threshold, scale your market exposure accordingly.
Validate bench-driven model tweaks with FundedPlays challenges
Try small, controlled bench-adjusted scenarios in a simulation environment before applying larger live stakes, focusing on how minute-share assumptions change projected margins.
How to translate participation reports into minute-share updates
Use a short protocol: map the missing starter s average minutes into the next-in-line reserves based on typical rotation patterns, then convert those minutes into a bench minute share and recompute the weighted rating. If minutes are unclear, use a probability-weighted approach that mixes starter and bench scenarios to reflect uncertainty.
When lines move because of late rotation news, consider hedging or scaling exposure to reflect the model s confidence interval and re-run simulations once final rotations are confirmed.
Practical examples: three lineup scenarios and model responses
Scenario A: Star sits on back-to-back and bench minutes expand
Walk through the method rather than inventing numbers. Start by identifying the starter s average minutes in the core rotation window and attributing those minutes to reserves according to historical replacement patterns. Pull starter and bench Net Ratings and compute a weighted team rating with the new minute shares. The difference between the new rating and the market s pre-announcement rating estimates the point swing you should expect to see reflected in the spread.
In this scenario you focus attention on whether reserve Net Rating plausibly covers the starter s loss. If the reserve Net Rating is below the starter s rating, the weighted team rating drops and the market will usually shift the spread accordingly. Always validate the modeled margin change against quick analogs from similar prior games.
Scenario B: Reserve unit underperforms efficiency-wise
If reserves routinely score but at markedly worse per-possession efficiency, the correct model response is to lower the reserve unit s per-100 possession offensive rating and recompute the weighted rating. This change often compresses totals because possessions produce fewer points on average while increasing spread volatility if defensive numbers diverge.
Use aggregated EPM values for reserves as a cross-check so that per-player impact aligns with observed unit-level efficiency. When aggregated EPM and unit Net Ratings diverge, investigate usage changes or lineup fit issues that could explain the discrepancy EPM methodology overview.
Scenario C: Rotation shortens due to injury, stars carry higher minutes
Shortened rotations often push starters toward higher minute shares and concentrate usage, which can raise expected scoring from star players but also increase variance and fatigue risk. Recompute minute shares with starters upweighted and reserves downweighted, then run simulations to see how both margin and total change under concentrated usage.
When modeling this case, include fatigue and usage effects in your simulations rather than treating the starter as a static per-minute performer. Historical short-rotation games provide backtest cases to check whether the model s predicted margin and variance line up with observed outcomes.
Implementation checklist: building bench-aware models
Data ingestion and update cadence
Ingest Starter and Bench splits from NBA.com/Stats and store daily snapshots so you can reconstruct what the market could see on any given day. Complement season benchmarks from Basketball-Reference to check whether short-term shifts are within historical range Basketball-Reference season starters and reserves summaries.
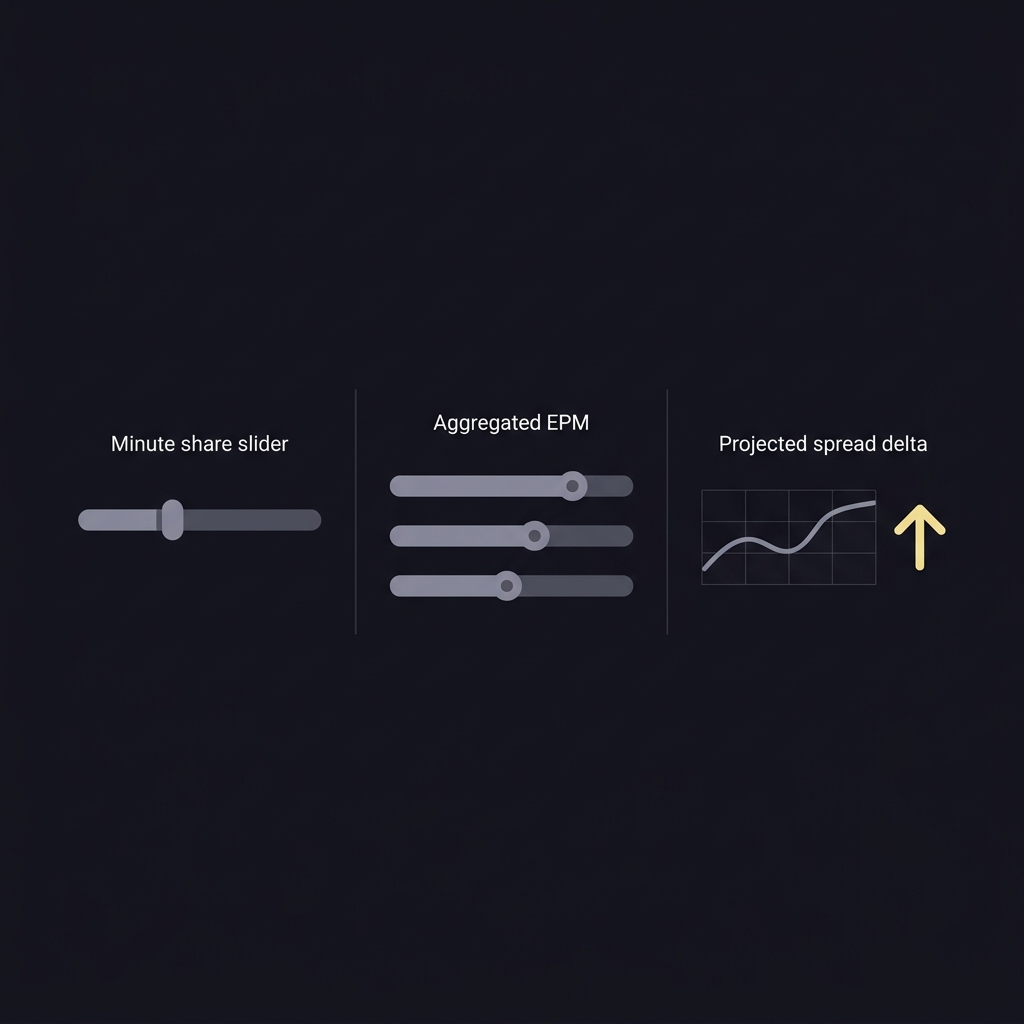
Recommended cadence is nightly for baseline updates and intraday for game-day minute-share revisions. Log each version of minute-share inputs and the resulting adjusted rating so that backtests can recreate decisions and outcomes.
Testing, backtesting, and monitoring
Backtest bench-adjusted rules on historically documented rotation changes and measure whether predicted margins would have reduced calibration error versus a baseline model. Use event-based splits for the test set so you evaluate true rotation shocks rather than slowly drifting averages.
Set monitoring alerts for when model revisions repeatedly diverge from market moves. That signals either a data quality issue in your minute-share mapping or an overfitting problem in the translation from player-level impact to unit-level ratings.
Reading market signals and sizing positions after bench-driven line moves
Distinguishing sharp money from public overreaction
When a line moves after bench news, evaluate whether the move is led by large, early bets from sharp liquidity providers or by a broad public reaction. Sharp-led moves that align with credible rotation mappings are more likely to reflect new, persistent information; public waves often overcorrect and present scaling opportunities.
Assess message flow: check bet timing, known sharp accounts if visible, and whether subsequent price reversion occurs. Use these signals to decide whether to scale quickly or to step in cautiously while waiting for final rotations.
Sizing rules when bench assumptions carry uncertainty
Scale positions to model confidence. If minute-share updates are definite use a normal stake. If you are running a probability-weighted mix between starter and bench scenarios, size to the weighted expected value and reduce exposure to reflect distribution width. Re-run simulations when final rotations are confirmed before increasing size.
Always preserve capital allocation rules for live trading: avoid moving more than a predefined fraction of bankroll on bench-driven assumptions unless the signals and market reaction are repeatedly validated in backtests.
Conclusion: integrating bench depth into regular workflows
Key takeaways
Bench depth matters because it changes the minutes-to-impact mapping that markets use to set spreads and totals. Use starter versus bench Net Ratings, minute-share forecasts, and aggregated EPM as complementary inputs when converting availability news into model adjustments NBA.com/Stats starter and bench team advanced filters.
Next steps are practical: instrument daily data pulls, implement the weighted team-rating formula, and run controlled simulation challenges to validate whether bench-based adjustments improve out-of-sample calibration.
Trigger adjustments when projected bench minute share changes noticeably or when starter-versus-reserve Net Rating gaps are large; use concrete minute thresholds and probability-weighted scenarios.
No. Bench points per game require normalization by minutes and efficiency; use per-100 possession metrics and unit-level ratings instead.
Yes. Use structured simulation challenges and virtual funded account workflows to validate strategies before live deployment.
References
- https://www.nba.com/stats/help/glossary
- https://www.teamrankings.com/nba/stat/bench-points-per-game?date=2025-04-10
- https://www.nba.com/stats/teams/advanced/?Season=2024-25&SeasonType=Regular%20Season&StarterBench=Bench
- https://www.basketball-reference.com/leagues/NBA_2025_starters_and_reserves.html
- https://dunksandthrees.com/blog/2023/estimated-plus-minus-epm-methodology
- https://www.fundedplays.com/challenges
- https://www.fundedplays.com
- https://www.fundedplays.com/blogs
- https://www.fundedplays.com/blogs/how-fundedplays-evaluations-work