
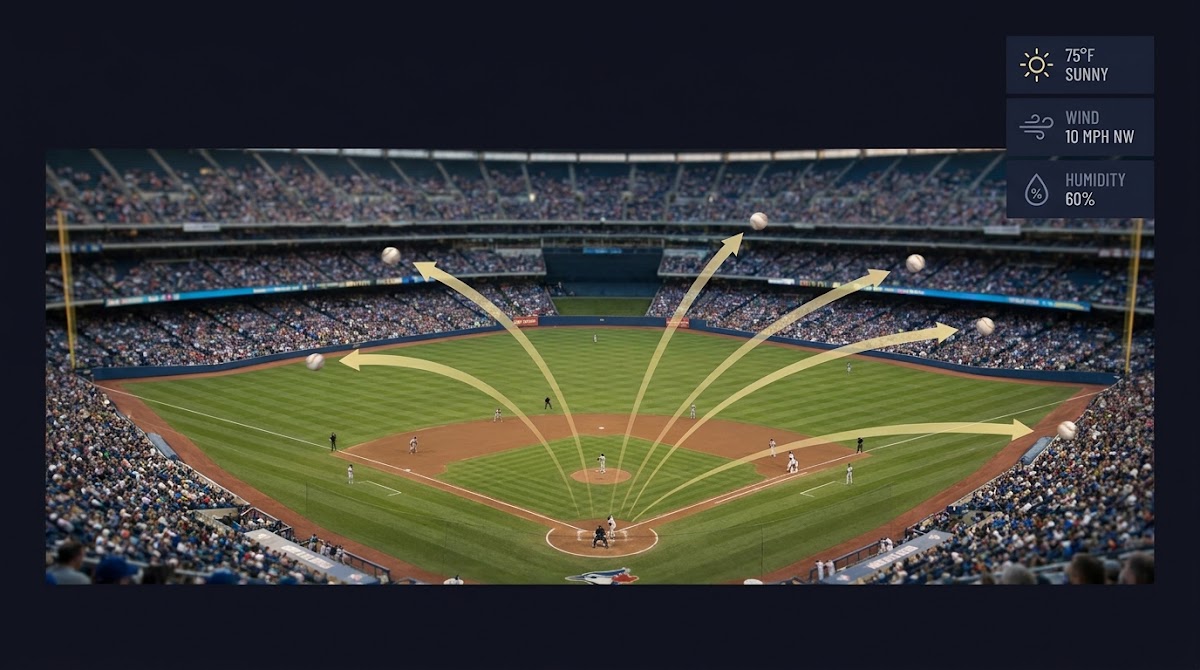
How Ballpark Factors Affect MLB Totals: definition and why it matters
Park factors are a comparative index that measures a ballpark's effect on run scoring relative to the league average, typically centered on 100. This index compares home and road performance to show whether a venue tends to increase or suppress runs, and using a park factor helps turn a single league average total into a location-adjusted expectation.
Good practice when using park factors is to rely on a multi-year sample because single seasons can be noisy; multi-year smoothing reduces random swings that would otherwise distort a totals projection.

Recent 2024 leaderboards continue to show meaningful park-to-park spreads in run environments, which reinforces that totals models should be park adjusted rather than based on a simple league average. For current season leaderboards and comparative indices consult a major park-factor source such as ESPN park factors and Baseball Savant.
How park factors are calculated and how to stabilize them
The standard method builds a home-versus-road comparison: compare runs scored and allowed in home games to those in road games, normalize the result to a league-average index around 100, and report whether the park is above or below that baseline. This home-vs-road method is the core logic behind most park-factor indices.
Practice park-adjusted totals with FundedPlays Challenges
Download a simple park-factor spreadsheet to test multi-year smoothing and weighted averages, or sign up for updates on stabilized baselines from a funded sports prediction platform.
Because a single season can be influenced by luck, lineups, or transient roster moves, analysts commonly use multi-year smoothing or weighted averages to stabilize their baseline. FanGraphs’ guide to park factors explains the basic calculation and why smoothing matters for a dependable index FanGraphs park factor guide.
Practical data sources for park factors include public leaderboards and play-by-play services, and you should note methodological differences: some providers adjust for league scoring environment while others include separate offensive and defensive park factors, and daily park factors with real-time weather are available at BallparkPal.
Structural park features that change batted-ball outcomes
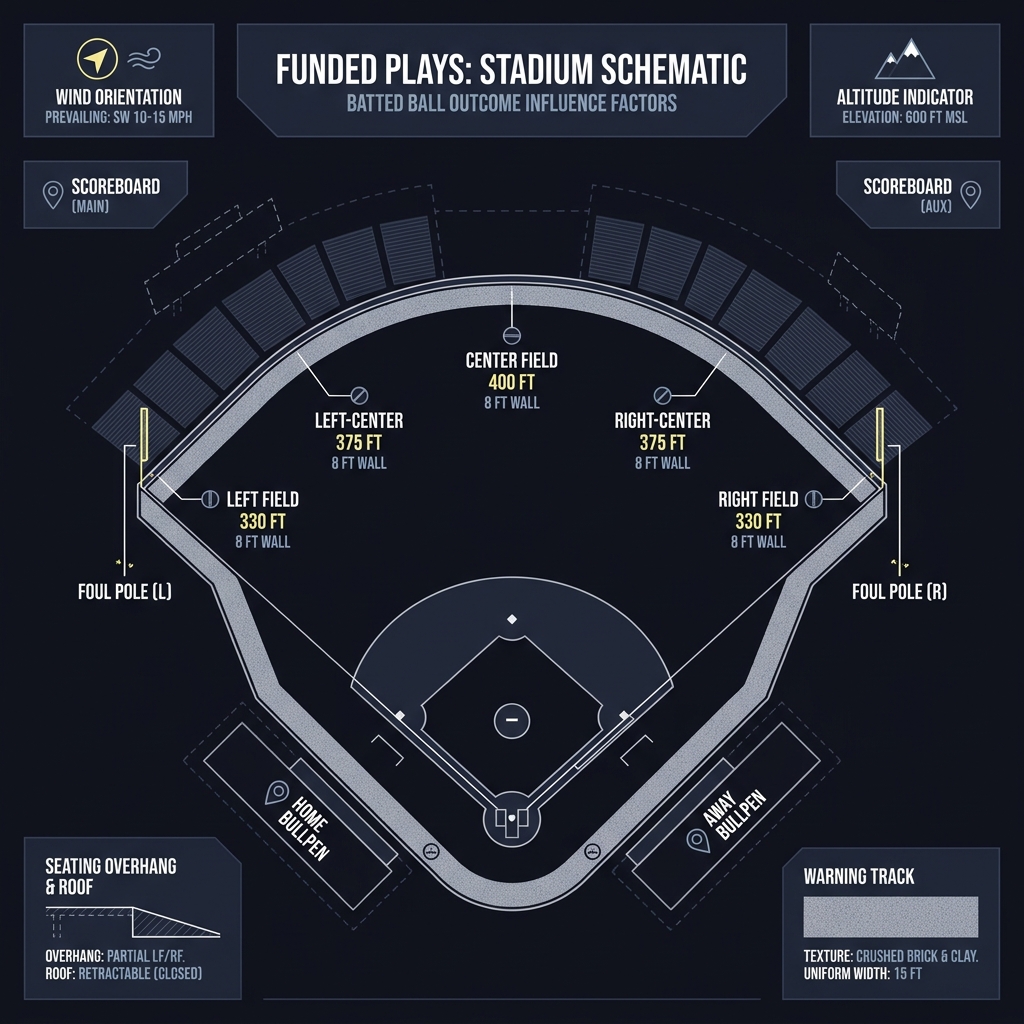
Field dimensions and wall heights shape batted-ball outcomes by changing the boundary a batted ball must clear for a home run and by altering angles for extra-base hits. These structural variables are reflected indirectly in park-factor indices because they systematically affect home and visitor performance over time.
Retractable and fixed roof status also matters because an open stadium exposes ball flight to wind and temperature, while a closed roof generally reduces those weather-driven swings. Where roof status changes across a season or during a game, modelers should treat roof state as a game-day modifier on the park baseline.
Playing surface matters too: turf fields often produce different ground-ball speeds and hops than natural grass, which can change defensive positioning and the frequency of hits. Park-factor indices typically embed these structural effects because they are persistent features of a venue, and you can consult seasonal leaderboards to see which parks consistently deviate from the league norm Baseball Savant park factors.
Weather, altitude, and the science behind home run changes
Peer-reviewed work finds that air density, which is driven by temperature and altitude, has a measurable and statistically significant effect on home run rates; warmer air and higher elevation both reduce air resistance and help balls carry further (air density table).
To use this finding in practice, start with a stabilized park factor and then layer forecasted conditions for game day. Estimate directional impact from temperature and altitude changes to refine the expected total.
Check whether forecasted temperature or elevation meaningfully alters air density relative to seasonal norms; if it does, apply a directional adjustment to the stabilized park factor and re-run your totals projection.
Because MLB standardized ball storage with the universal humidor in 2022, humidity-driven variability between parks has been reduced, but the independent effects of temperature and altitude remain relevant and should be treated as separate adjustments from humidor-related changes research on temperature and home runs.
Why bullpen quality and times-through-the-order matter for late-game scoring
The starter times-through-the-order penalty describes how opposing hitters generally perform better each time they face a starting pitcher later in a game; accounting for that effect changes late-inning run expectancy and therefore can alter a totals projection.
Bullpen depth and usage patterns interact with park effects because strong late relief can suppress late runs even in hitter-friendly parks, while weak relief can magnify park-derived run scoring in the final innings. Basic bullpens metrics and recent usage trends should be part of a totals checklist analysis of the times-through-the-order penalty.
Simple approaches to fold bullpen context into a totals model include adjusting late-inning run probability by bullpen ERA and leverage distribution, or applying a small times-through-the-order multiplier when a starter looks likely to complete multiple trips through the order.
A practical checklist for building park-adjusted totals projections
Step 1, pick and stabilize your park factor baseline: use multi-year smoothing or a weighted average that favors recent seasons but preserves sample stability. This stabilized park factor is your starting point for any game-day adjustment. See how Funded Plays evaluates baselines here.

Step 2, layer forecasted weather and roof status: adjust the baseline for temperature, air density, and whether the roof will be open or closed for the game. A modest directional bump for warm, high-altitude conditions is usually appropriate above the baseline.
Step 3, incorporate team bullpen and lineup TTO expectations: before finalizing a totals projection, check bullpen depth and likely starter longevity to adjust late-game scoring expectations. These three steps form a concise, repeatable workflow for converting a league average total into a park-adjusted number 2024 park leaderboards.
Common mistakes and park-factor pitfalls to avoid
Overreacting to single-season swings is a common trap; a large departure in one year often reverts, so use sample weighting or smoothing rather than flipping a baseline based on a single season's noise how to stabilize park factors.
Ignoring game-day weather or roof changes can produce predictable misses, especially in parks where roof position or local temperature routinely changes carry. Always check the official roof and forecast before finalizing a totals call.
Forgetting bullpen context or scheduling quirks can bias a projection, because late-game scoring is sensitive to relief quality and how managers deploy arms. A quick bullpen depth check and a times-through-the-order sanity check reduce that bias.
Worked examples: applying park factors and weather to two totals scenarios
Example A, high-altitude warm park: start with a stabilized park factor above 100 to reflect a consistently hitter-friendly venue, then apply a positive air-density adjustment if forecast temperatures are well above seasonal norms. Expect a directional increase in home run probability on game day and raise the total accordingly.
estimate air density adjustments for game-day temperature and altitude
Use as a directional guide
Example B, humidified ballpark with deep bullpen: begin with a park baseline that may show fewer home runs than similar open-air parks because the humidor moderates ball carry; then offset that with bullpen strength, which can further suppress late runs. The net adjustment may be neutral or slightly lower than the league average total depending on matchup details MLB humidor policy.
Document your steps and run sanity checks: compare the adjusted total to the recent run environment, check the implied runs per inning, and ensure you are not double-counting the same effect across park and weather adjustments. See the Funded Plays blog for examples Funded Plays blog.
How the 2022 humidor policy and 2024 leaderboards reshape baselines
MLB’s 2022 humidor policy standardized ball storage in all 30 parks, reducing humidity-driven variability but not eliminating differences driven by temperature and altitude; modelers should treat humidor effects as a moderating factor rather than a cure-all for environmental variance announcement on humidors.
Looking at 2024 park leaderboards confirms that there are still sizable park-to-park spreads in overall run environment, so a stabilized baseline that references recent leaderboards provides a realistic starting point for adjustments Baseball Savant park factors.

Open questions remain, such as whether future monitoring of ball construction or incremental rules changes will shift baseline park effects year to year; keep baselines reviewable and document any one-off adjustments.
Putting it together: decision criteria and a final checklist
Decision criteria: trust a park-adjusted total when the stabilized park factor moves your expected runs by a material margin relative to market lines, when forecasted weather is meaningfully different from season norms, or when bullpen and TTO signals point to late-inning deviation.
Key red flags include small sample park factors, sudden weather swings, and last-minute bullpen changes; any of those should trigger re-evaluation before you lock an adjusted total common pitfalls and fixes.
Two-minute pre-game checklist: verify stabilized park factor, confirm game-day roof and forecasted temperature, check starter longevity probability and bullpen depth, and document the directional impact. If all checks pass, apply your adjustments and compare the result to market lines for an informed decision. For more on Funded Plays visit Funded Plays.
A park factor quantifies how a stadium changes run scoring compared to the league average; use it to adjust league totals to a venue-specific expectation.
The universal humidor reduced humidity-driven differences, but temperature and altitude still change ball flight and should be adjusted for.
Include measures of bullpen depth and likely starter times-through-the-order impacts to adjust late-inning run probabilities.
References
- https://www.espn.com/mlb/stats/parkfactor/_/season/2024
- https://baseballsavant.mlb.com/leaderboard/statcast-park-factors
- https://blogs.fangraphs.com/a-guide-to-park-factors/
- https://baseballsavant.mlb.com/park-factors?year=2024
- https://www.cell.com/one-earth/fulltext/S2590-3322(23)00124-0
- https://community.fangraphs.com/the-starter-times-through-the-order-penalty-lives/
- https://www.fundedplays.com/challenges
- https://www.fundedplays.com
- https://www.fundedplays.com/blogs
- https://www.fundedplays.com/blogs/how-fundedplays-evaluations-work
- https://www.mlb.com/news/mlb-to-use-humidors-in-all-30-ballparks
- https://www.ballparkpal.com/Park-Factors.php
- https://www.researchgate.net/figure/Air-density-in-some-typical-baseball-stadiums_tbl2_228668381