

What accuracy means for football prediction apps
When people ask what makes the most accurate tools, they are often talking about how often a predicted outcome happens and how well stated probabilities match real results. In plain terms, accuracy can mean hit rate, calibration, or long-term expected value, and each tells a slightly different story about an app's usefulness.
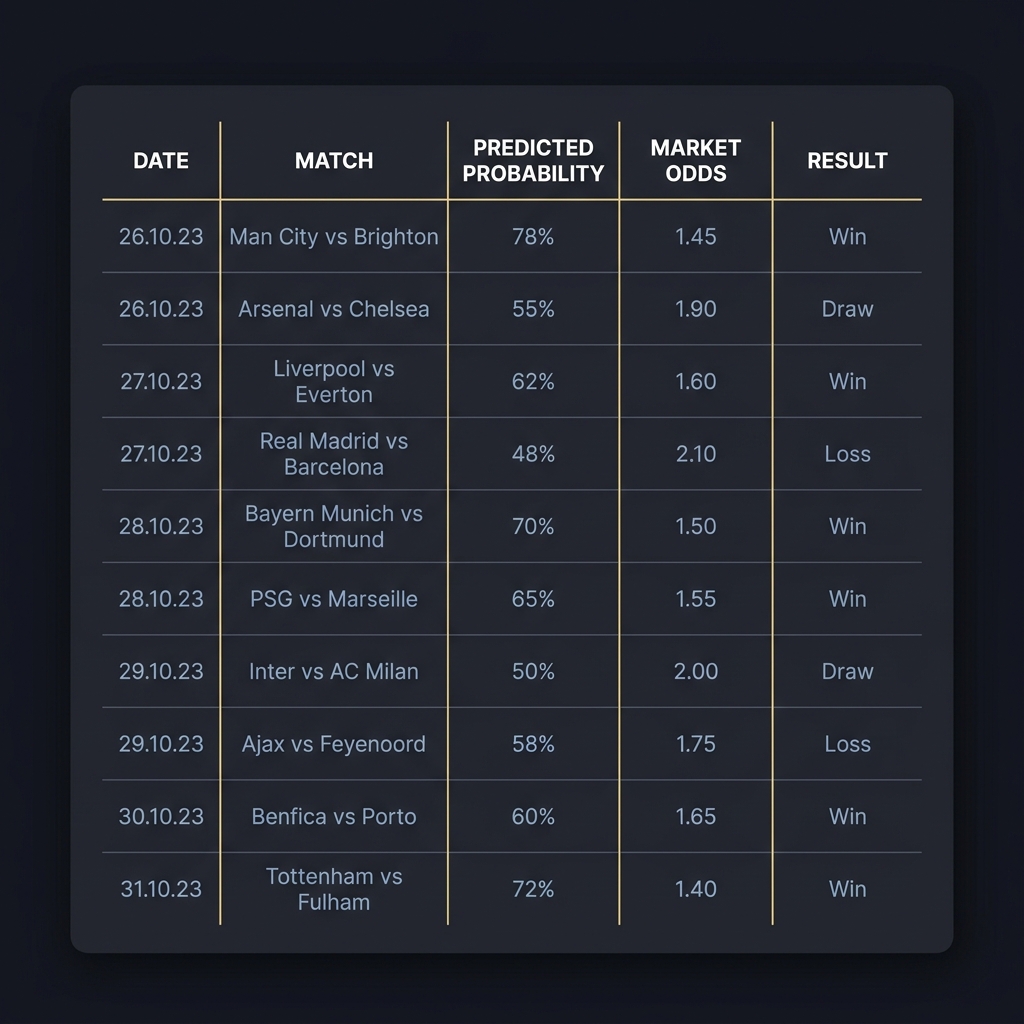
Simple tracker to record predictions and outcomes
Keep entries brief
Hit rate is the share of predictions that turn out correct. Calibration asks whether, for events assigned a 60 percent chance, about 60 percent actually happen. Expected value combines your probability estimates with market odds to show whether a pick has theoretical long term worth.
Think of these three like a camera: hit rate is how many pictures come out not blurry, calibration is whether the camera's exposure estimate matches the scene, and expected value is whether those pictures are worth selling. This trio helps prevent relying on a single percentage that can be misleading.
Defining prediction accuracy for football prediction apps
Hit rate, calibration, and expected value are commonly used terms; understanding them helps avoid simple misjudgments. For example, a high hit rate in low-odds markets can mask poor long-term returns, while well calibrated probabilities that ignore market odds can still lead to losses.
Accuracy also depends on how the app expresses its forecasts. Apps that provide probability estimates make it possible to measure calibration and expected value. Those that only give directional picks limit the depth of evaluation you can do. (See analysis of AI prediction accuracy.)
How football prediction apps generate forecasts
Most apps combine several inputs to form predictions. Typical inputs include match statistics, player availability notes, recent form, and market odds which are often used as a signal rather than a target. The way these inputs are combined varies between apps.
Data sources and inputs
Common data sources are historical match stats, lineups and injury reports, situational factors such as travel or weather, and the betting market itself. Market odds are often useful as a distilled summary of collective expectation and can be used as a comparative benchmark.
When evaluating an app, check whether it lists the types of inputs used. Transparency about inputs makes it easier to understand where predictions come from and to test whether any single input drives results.
Common modeling approaches
Broadly, forecasts come from three families: rules-based systems, statistical models, and machine learning models. Rules-based systems apply human-defined heuristics. Statistical models use structured formulas and distributions. Machine learning models can detect complex patterns but may be less transparent. (See analysis on machine learning models.)

Each approach has tradeoffs. Rules are clear but can miss subtle patterns. Statistical models are interpretable but may be limited by assumptions. Machine learning can be powerful yet opaque and prone to overfitting unless carefully validated.
Human vs algorithmic predictions
Some apps present human-curated forecasts or blends of analyst opinion and algorithmic scoring. Human insight can capture context that data miss, while algorithms provide consistency and scale. The best choice depends on your priorities for transparency and consistency.
Look for apps that explain whether predictions are automated, human-assisted, or a hybrid, because that affects how you should test and interpret results.
How to measure accuracy: practical metrics to use
Measuring accuracy beyond a single number requires a few simple metrics that are easy to compute and interpret. Start with hit rate, then check calibration, and finally translate probabilities into expected value. That sequence gives both descriptive and decision-focused views of performance.
Explore the FundedPlays Challenges and evaluation approach
Start a simple tracking log now, using a spreadsheet to note date, prediction, probability, odds, stake, and result so you can evaluate performance consistently.
1. Hit rate and its limits. Hit rate is the percentage of predictions that are correct in a defined sample. It is easy to understand but can be misleading when picks are concentrated in low-odds markets.
2. Calibration and a Brier-like perspective. Calibration measures whether the probabilities match outcomes over time. A perfectly calibrated system that assigns 70 percent to a set of events should see roughly 70 percent of those events occur. Thinking in these terms helps you judge whether stated probabilities are believable.
3. Measuring value with expected value and ROI. Expected value combines your probability and the available odds to estimate theoretical long-term return. Tracking implied odds alongside your probabilities shows whether the market offers a margin you can exploit. For clarity, log both the app probability and the market implied probability for each pick.
A quick mini example: if an app assigns 50 percent to a result but the market odds imply 40 percent, that pick has positive expected value on paper. Recording this for each pick lets you see whether those theoretical advantages turn into consistent gains over time.
Hit rate and its limits
Hit rate is intuitive but limited because it ignores the odds attached to each pick. Frequent correct calls at short odds may not cover occasional large losses on longer shots. Always view hit rate alongside value measures.
Also, avoid small sample conclusions. Short winning streaks can inflate perceived accuracy, while short losing runs can be temporary downturns in a larger process.
Calibration and Brier score in plain terms
Calibration asks whether assigned probabilities match observed frequencies. If predictions are systematically overconfident or underconfident, that is a signal to adjust how you treat the app outputs. You can observe calibration simply by grouping predictions into bands and comparing expected and actual rates.
A Brier-like view aggregates squared errors between predicted probabilities and outcomes. You do not need the formal math to benefit from the idea: smaller average deviation between predicted chance and outcome is better.
Measuring value: ROI and expected value
Track both realized ROI and cumulative expected value to detect whether apparent short-term returns are sustainable or just the result of variance.
Expected value and ROI focus on whether the probabilities translate into profitable stakes when compared to market odds. For each prediction, record the app probability and the market implied probability, then compute whether the pick offers positive value. Over time, sum expected value contributions to see directional profitability.
A simple evaluation framework you can follow
Use a three-step framework to evaluate any app: define your horizon and sample, collect and normalize results, and apply metrics consistently. A repeatable routine removes guesswork and reveals patterns that matter. See Funded Plays.
Step 1: define your horizon and sample. Decide how long you will test and which markets you will include. Keep the scope manageable so you can collect enough data without getting overwhelmed.
Step 1: define your horizon and sample
Choose an initial test window in weeks rather than days, and select a small set of markets you follow. Narrow tests reduce noise and make it simpler to judge whether the app suits your style.
Document the timeframe and filters before you start to avoid changing evaluation criteria mid test, which can bias your conclusions.
Step 2: collect and normalize results
Keep a prediction log that records date, match, predicted probability, market odds, stake, and outcome. Normalizing odds formats and probability scales is important when combining predictions from different sources or markets.
A consistent log also makes it straightforward to compute hit rate, calibration bands, and expected value without guesswork.
Step 3: apply metrics and compare
After your chosen window, compute hit rate, check calibration across probability bands, and sum expected value. Compare these metrics to a simple baseline such as market implied probabilities to see whether the app offers a consistent advantage.
Good evaluation frameworks emphasize documentation and reproducibility. Save snapshots of the app outputs you test so you or a collaborating analyst can verify results later. See the Funded Plays blog for related posts.
Good evaluation frameworks emphasize documentation and reproducibility. Save snapshots of the app outputs you test so you or a collaborating analyst can verify results later.
Decision criteria: what to check before trusting an app
Before you trial or subscribe, run a short checklist focused on transparency, data access, statistical robustness, and user experience. These practical checks help you avoid surprises and make testing simpler.
Decide whether you want learning, model inputs, or a service to follow, then test objectively with a matching horizon and metrics.
Transparency and data access. Prefer apps that publish historical predictions, provide probability outputs, or allow export of past signals. If an app hides its raw outputs, it is hard to verify claimed accuracy independently.
Statistical robustness and sample size. Look for clarity on the timeframes and samples used to report performance. Performance claimed over a tiny sample is less credible than long term, well documented records.
User experience and support. Update frequency, markets covered, and the ease of extracting predictions all matter. If it is difficult to export or record results, you will struggle to run an objective test.
Common mistakes and pitfalls when judging accuracy
Many users fall into predictable traps when evaluating prediction apps. Recognizing these mistakes up front will help you form a sound judgment rather than an emotional one.
Overfitting to short-term runs. Short streaks of wins or losses are normal; drawing conclusions from them can lead to wrong decisions. Be patient and rely on your predefined horizons when assessing performance.
Overfitting to short-term runs
Short sample bias can make a system look much better or worse than it is. Use your evaluation framework and avoid adjusting rules after seeing initial results.
Confusing correlation with causation. A good-looking correlation between an app signal and an outcome does not prove a causal mechanism. Consider whether the data input logically explains the result or if it may be coincidental.
Ignoring market odds and variance
Market odds encode collective information and variance. Ignoring them risks mistaking frequent low-odds wins for sustainable edge. Always contrast app probabilities with implied market probabilities to see whether value is present. (See analysis examining prediction site effectiveness.)
How to test an app yourself: a step-by-step trial plan
Set up a controlled test that runs for a few weeks to a few months depending on your available time. Keep stakes small if you use real money and treat early tests as learning experiments rather than profit attempts.

Step 1: set up a test account and tracking sheet. Use a simple spreadsheet with the columns discussed earlier and record every prediction you test. Make entries immediately to avoid hindsight bias.
Set up a test account and tracking sheet
Create a baseline by recording market-implied probabilities for the same events you test. This baseline helps you see whether the app actually adds value beyond what the market expects.
Step 2: run blind tests vs a control baseline. Where practical, run predictions blind to your own betting behavior so choices are not influenced by short term emotions. Compare results to the baseline over time.
Run blind tests vs a control baseline
Blind tests mean you record the app's prediction first, then decide whether to act. This keeps the evaluation pure and prevents selective recording of only winning picks.
Step 3: review results and decide next steps. After your pre-decided window, compute your metrics and compare them to the baseline. Decide whether to continue testing, scale up, or stop the trial based on documented thresholds.
Review results and decide next steps
Create clear decision rules before you begin. For example, require demonstrable positive expected value over your test horizon before increasing stake sizes. Avoid changing thresholds mid test.

Responsible bankroll and risk management while testing
Treat any real-money testing as a controlled experiment with explicit stake limits. This preserves capital and keeps your assessment objective.
Sizing stakes and recording outcomes. Use a simple stake-sizing rule such as flat stakes or a small fixed percent of a testing bankroll. Record every stake and outcome so tracked ROI reflects reality.
Treat testing as learning, not income
When testing, your goal is information. Keep monetary exposure low enough that you can complete the full test without being forced to stop by emotional reactions to swings.
Avoiding tilt and emotional decisions. Do not increase stakes after a short losing run or chase missed winnings. Discipline in stake sizing preserves the statistical integrity of your evaluation.
Practical scenarios: testing plans for beginner, intermediate, advanced users
Different skill levels benefit from tailored plans. Choose the plan that matches your time and analytical comfort, and stick with it for the test window you defined.
Beginner: small sample, limited markets
Beginners should focus on a single league or market and run a short, low-commitment test to learn the process. The aim is to complete a clean dataset you can analyze, not to make money right away.
Intermediate: multiple leagues and probability tracking. Expand to several leagues, track probabilities and implied odds, and start to look at calibration across different contexts.
Advanced: model integration and backtesting
Advanced users can feed app probabilities into their own models or run backtests on archived signals where available. Combine multiple metrics and look for consistent advantage across seasons and market types.
Across all levels, document decisions and iterate your plan based on what you observe rather than emotion.
How analytics and third-party tools can deepen evaluation
Nonproprietary tools add rigor without advanced technical skills. Spreadsheets, charts, and simple rolling averages reveal trends and calibration issues quickly.
When to consider model comparison tools. If you have many signal sources or large datasets, model comparison tools can help quantify differences. Be aware that automated backtests depend on clean, well formatted input data.
Using simple spreadsheets and charts
Pivot tables, grouped calibration charts, and rolling hit rate plots are often enough to spot persistent patterns. Keep visualizations simple and focused on the metrics that matter to your decision rules.
Limitations of automated backtests. Backtests can be misleading if they use data not available at the prediction time or if they overfit historical quirks. Always sanity check surprising backtest results by sampling raw predictions and outcomes manually.
When a prediction app may not be the right fit
An app might be poorly matched to your goals if it focuses on markets you do not follow, lacks transparency, or costs more than the likely learning value. Recognizing mismatch early saves time and money.
Poor transparency or data access should be a red flag. If you cannot export or view past predictions, it is hard to verify any accuracy claims independently.
Mismatch with your goals
Consider whether the app emphasizes short term directional picks, long term probability estimates, or a niche market. Choose a tool that aligns with whether you want to learn, to augment an existing model, or to trade professionally.
Cost versus perceived value. Weigh subscription or usage costs against the time and learning value you expect to get. If the app is opaque and expensive, it may not be worth a full trial.
Summary: choosing the most accurate football prediction app for you
Recap the key checks before committing: confirm transparency, set a clear testing plan, record predictions faithfully, and apply the suggested metrics. These steps make it possible to judge accuracy empirically.
Accuracy is not one number. Treat it as a set of properties you can test. Past short term results do not guarantee future performance, so disciplined evaluation matters more than intuition.
Checklist recap
Use a short checklist: request raw probability outputs, ensure export or easy recording, predefine your test horizon, and set stake and decision rules. Consistency beats impressions.
Next steps for a trial include building your tracking sheet, running a defined test window, and reviewing outcomes against a market baseline. Keep a cadence for reassessment and be ready to iterate.
Further resources and how to keep improving your evaluation skills
Maintain a progress tracker and a simple review cadence, for example a biweekly review during a multiweek test. Incrementally increase complexity as you gain confidence. Read about how Funded Plays evaluations work for one approach to structured testing.
Core practice is repetition. Iterate horizons, markets, and metrics based on what you learn. Over time, disciplined testing and clear records improve your ability to separate luck from skill.
Run an initial test for several weeks to a few months depending on activity; use that period to collect a clean, consistent dataset before drawing conclusions.
Begin with hit rate and then compare app probabilities to market implied odds to evaluate value.
Short-term streaks can be misleading; rely on your predefined test horizon and documented metrics rather than short runs.
References
- https://thexgfootballclub.substack.com/p/which-machine-learning-models-perform
- https://thedatabetics.com/insights/how-accurate-are-ai-football-prediction-models/
- https://cswsport.org.uk/do-football-prediction-sites-work-analyzing-their-accuracy-and-effectiveness/
- https://www.fundedplays.com
- https://www.fundedplays.com/blogs
- https://www.fundedplays.com/blogs/how-fundedplays-evaluations-work
- https://www.fundedplays.com/challenges