
What football prediction apps actually do and what to expect
Definition: prediction apps versus sportsbooks and betting tips
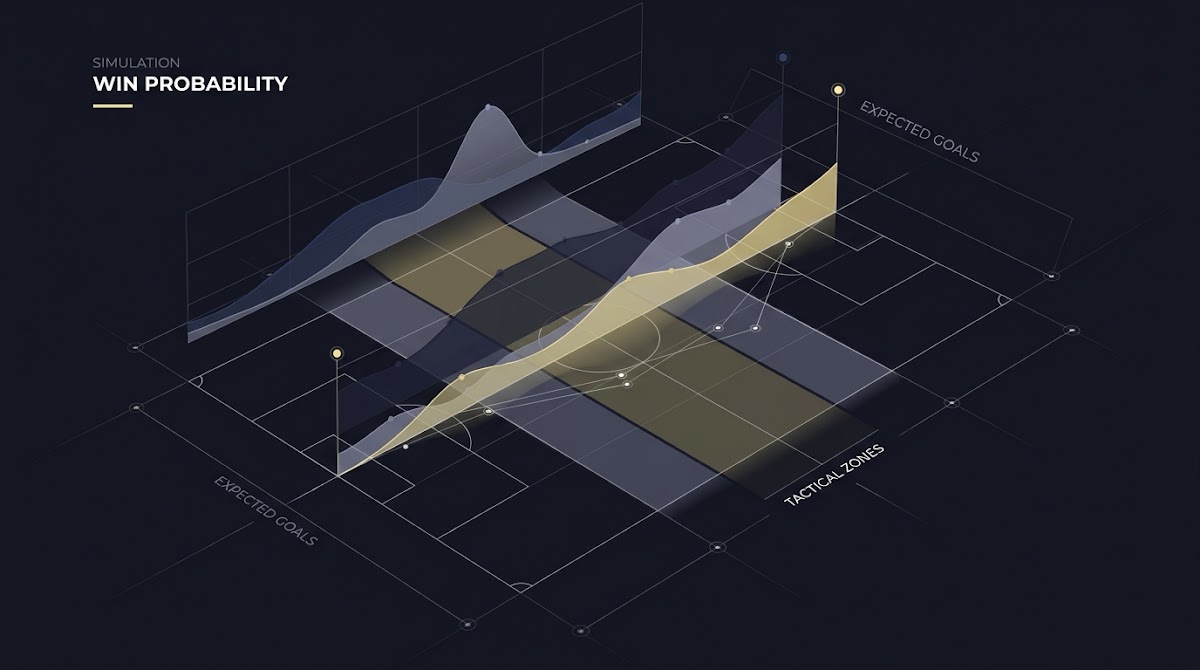
Football prediction apps are decision-support tools that output probabilistic forecasts for matches or events rather than guaranteed picks. The typical output is a probability distribution for outcomes, for example a three-way line for home-win, draw and away-win, which a user interprets as guidance for decisions rather than a promise of results. This distinction matters because well-built systems communicate uncertainty and refresh their forecasts as new information arrives.
Serious prediction tools aim to show probabilities and explain the underlying model, not to offer single ‘‘sure’’ selections. Opta style public explainers show how probability-based outputs are the norm for tournament and match forecasting, with systems designed to help users weigh options and manage risk rather than guarantee winnings. Opta Analyst article on tournament probabilities

Common user scenarios and realistic outcomes
Users come to football prediction apps for various reasons: to gain a quantitative second opinion, to test systems for research, or to compete in skill-based challenges that emphasize consistency. For people exploring funded challenge platforms, the emphasis is on demonstrating repeatable forecasting skill under structured rules rather than placing real-money wagers.
When you use a prediction app, expect probabilistic guidance and periodic updates rather than infallible calls. Treat outputs like a weather forecast that helps plan action under uncertainty, and verify any claims of accuracy by looking for published evaluation metrics and sample sizes.
simple daily pick and result tracker for backtesting
Use for logging and simple calibration checks
How modern AI football prediction models work: power ratings, xG and Monte Carlo
Power ratings and team-strength models
At the core of many top systems are power ratings or team-strength models that quantify how many goals a team is expected to score or concede against an average opponent. These ratings provide a consistent baseline so modelers can compare teams on a common scale and project expected outcomes across matchups.
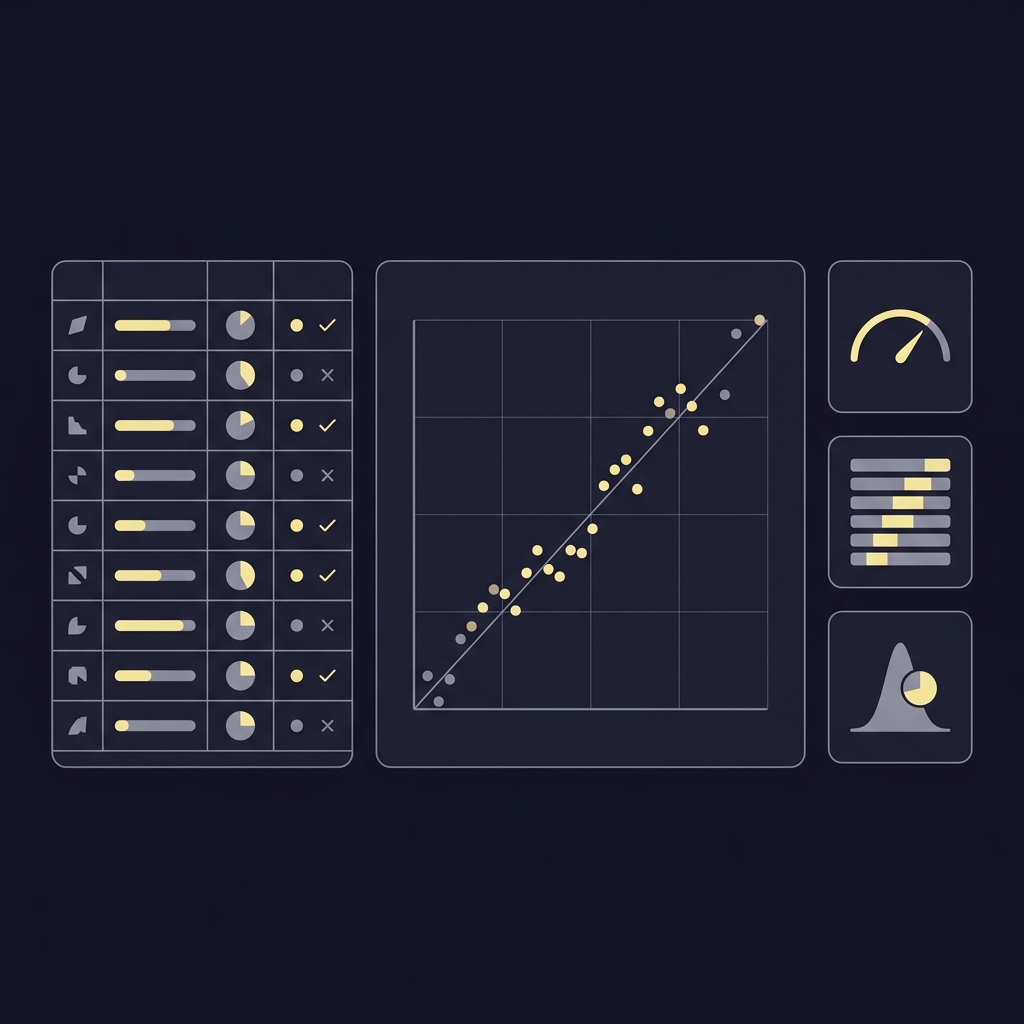
Public methodology pieces describe how power ratings are updated from match results, form, and other inputs and how they feed into probabilistic forecasting. For a practical example of this foundational approach, see how Opta outlines power rating construction and usage. Opta power rankings explainer
Expected goals (xG) inputs and feature engineering
Expected-goals models add an event-level layer of predictive signal by estimating the chance of a shot becoming a goal given context such as shot location, assist type, and buildup play. xG frameworks improve short-term forecasting and help correct for noisy match outcomes that can mislead simple results-based ratings.
Well-documented xG descriptions and validation guidance show why event-level features are valuable inputs for modelers who want better predictive sensitivity to chance quality. StatsBomb guidance on expected goals
Compare model explainers before you test
Compare whether a service explains its power ratings, xG inputs and simulation approach before testing its forecasts yourself.
Monte Carlo simulations to convert ratings into match and tournament probabilities
Once you have team ratings and xG-based event probabilities, Monte Carlo simulation ensembles are a common way to turn those signals into match and tournament probabilities. Simulations run thousands or millions of match scenarios to estimate the distribution of possible outcomes and tournament paths, producing consumable probabilities for users.
Public tournament work uses Monte Carlo methods combined with power ratings to publish match and competition probabilities, illustrating how simulation ensembles translate model inputs into user-facing forecasts. Opta Analyst article on tournament probabilities
Why official, event-level data and update cadence matter
What counts as high-quality data for football models
Official feeds provide reliable timestamps, player involvement, shot coordinates and granular event types that many models need to build accurate feature sets. Models built on patchy or scraped feeds are more likely to miss context that affects xG calculations or team-strength updates.
Stats Perform and other established providers are widely used as official data partners for major competitions, reinforcing that vetted pipelines and event-level feeds are the standard for serious forecasting systems. Stats Perform press release

How often models should refresh ratings and why cadence affects accuracy
Update cadence matters because team strength and situational factors evolve between fixtures. Models that refresh ratings daily or after each match can capture swings that weekly or static updates miss, while overly frequent updates without smoothing can overreact to noise.
When comparing apps, check how often they reprocess event data and whether they explain their smoothing or decay rules for ratings. Transparent cadence statements help you understand the timeliness and stability of published probabilities.
How accuracy and calibration are measured: Brier score, log loss and reliability plots
Proper scoring rules: why Brier and log scores matter
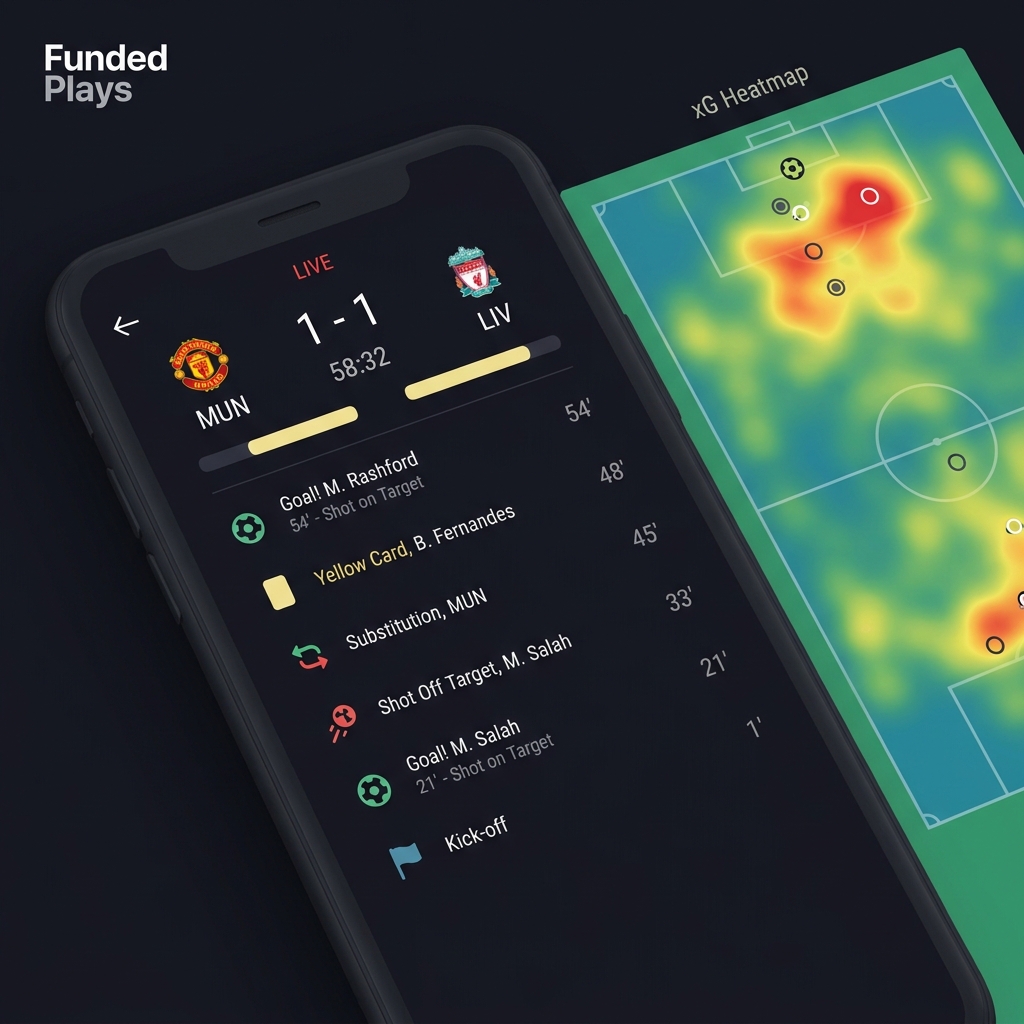
Proper scoring rules reward forecasts that are both well calibrated and sharp, and they are the accepted standard for evaluating probabilistic predictions. Two common choices are the Brier score and the logarithmic score, which respectively measure squared probability error and penalize unlikely events given the forecasted probabilities.
Statistical literature explains why strictly proper scoring rules like Brier and log loss are preferred for assessing probabilistic forecasts, because they incentivize honest and well-calibrated probability estimates. Journal article on proper scoring rules
Calibration plots and reliability diagrams explained
Calibration shows whether predicted probabilities match long-run frequencies. A reliability diagram groups similar forecasts and compares the average predicted probability to the observed outcome frequency, making it easy to see underconfidence or overconfidence.
Sharpness is the concentration of probabilities away from the baseline; good systems aim for both calibration and sharpness. Tools for calibration and temperature scaling are commonly used to present a clear picture of forecast behavior. Google Developers guide to calibration
What to ask apps about their evaluation reporting
When vetting an app, request published scores on Brier and log loss over clearly defined date ranges and sample sizes, accompanied by calibration plots or reliability diagrams. This lets you see not only average performance but where the model is well calibrated or not.
Good evaluation reporting includes details on the test period, league coverage, and whether results exclude certain edge cases. Insist on sample sizes and date ranges so you can judge whether reported metrics reflect robust performance.
A practical buyer checklist: how to evaluate and compare football prediction apps
Minimum disclosure and transparency checklist
Use a short checklist when you compare candidate apps. At minimum, look for disclosed data sources, specified leagues covered, update cadence, published evaluation metrics such as Brier score or log loss, and calibration plots. Transparency on these items is a baseline for trust.
Prefer services that publish methodology notes explaining power ratings, xG inputs and whether they use simulation ensembles, since these details show whether a provider follows standard, explainable practices. Opta power rankings explainer
Coverage, update cadence, model explainability and evaluation
Compare apps side-by-side on coverage and cadence: which leagues are supported, how timely are updates, and do explainers show how the model treats injuries or schedule effects. Also note whether the provider publishes raw probability tables you can test or download for your own backtests.
When possible, trial a service on a small scale and log outcomes to compare reported scores with your own backtest results. A transparent provider will make it feasible to reproduce their broad performance claims using published data and documented methodology.
Common mistakes users make with football prediction apps
Misreading probabilities as certainties
One common error is treating a 60 percent forecast as a sure thing. In probabilistic forecasting, a 60 percent probability means that out of many similar situations you would expect the predicted outcome to occur roughly 60 percent of the time. That still implies a sizable chance of an alternative result and must be managed accordingly.
Framing forecasts as probabilities helps avoid this trap, and checking an app's calibration reports will show whether its 60 percent predictions actually win around 60 percent of the time in practice. Opta Analyst article on probabilistic outputs
Overfitting to recent results and ignoring sample size
Another frequent mistake is overreacting to short-term streaks. Small samples can create apparent trends that vanish with more data, so avoid giving too much weight to a handful of matches when judging model quality.
Ask providers about sample sizes and date ranges for reported metrics so you can judge whether a claimed edge holds across meaningful volumes of matches. Proper scoring rules and calibration checks help protect against overfitting. Journal article on scoring and estimation
Practical examples: reading a match probability and turning it into a decision
Example scenario: interpreting a 55-25-20 home-draw-away probability line
Imagine an app shows a 55-25-20 line for home, draw and away. That means the model estimates a 55 percent chance the home team wins, a 25 percent chance of a draw, and a 20 percent chance the away team wins. Over many similar matches with that forecast pattern, a well-calibrated system should see the home team win about 55 percent of the time.
To judge whether you should act on the line, check the provider's calibration plots and scoring history for similar probability bands so you know whether 55 percent predictions are generally accurate. If the app provides league-specific calibration, prefer that to generic numbers.
The best app depends on your priorities: prefer services that disclose official event-level data sources, explain power ratings and xG inputs, publish proper scoring rule metrics and calibration plots, and maintain a transparent update cadence.
When to act: combining probabilities with personal edge and staking rules
Turn a probability into a personal decision by comparing the model probability with your own estimate or the market. If you believe the true probability is higher than the app's number, you may have an edge to act on. Convert the perceived edge and your confidence into conservative staking rules that control downside.
Concrete routines include logging your expected value calculations and only placing stakes when you have a documented edge and a pre-defined staking rule. Always remember that probability guidance reduces uncertainty but does not eliminate it. StatsBomb explanation of event-level signal
Using football prediction apps responsibly and integrating them into your workflow
Treating apps as decision-support: logging, backtesting and continuous review
Integrate predictions into a disciplined workflow: log every forecast, track outcomes, and run simple backtests to measure how the app's probabilities perform for the leagues you care about. This practice helps you learn whether the tool complements your own judgment and where it may fall short.
Periodic review of logs should include checks for calibration drift, changes in league behavior, or model updates that affect probability distributions. If an app publishes evaluation metrics, compare their numbers with your in-house backtest results to confirm consistency. Guide to calibration and evaluation practices
Responsible use reminders and platform transparency
Always treat outputs as informational. No app can guarantee profit, and trustworthy services frame forecasts as decision-support while disclosing uncertainty and evaluation limitations. When an app claims unusually high accuracy, seek the underlying scoring reports and sample sizes before increasing reliance.
For users interested in structured, skill-based formats, funded challenge platforms offer a way to demonstrate forecasting ability under set rules while emphasizing discipline and transparency rather than gambling promises. Stats Perform data partnership announcement
Conclusion: choosing an app that fits your needs and next steps
Summary of the key evaluation points
Choose an app that discloses data sources, explains its methodology, publishes proper scoring rule metrics and shows calibration plots. Prioritize timely update cadence and clear league coverage so the forecasts match the contests you follow.
Suggested next steps for further reading and testing
Run a small trial, log forecasts and outcomes, and compare published scores to your backtest. Look for methodology explainers and aim to understand how a provider constructs power ratings, incorporates xG inputs, and uses simulation to produce probabilities. This due diligence provides the best chance of finding a tool that truly supports your decision-making.
Accuracy varies by model, data quality and league; look for published Brier or log loss scores and calibration plots to judge real-world performance.
xG, or expected goals, estimates shot quality using event context; it improves short-term prediction by capturing chance quality beyond final scores.
No. Reputable apps present probabilistic forecasts as decision-support and do not guarantee profits; outcomes depend on individual use and uncertainty.
References
- https://theanalyst.com/eu/2024/06/euro-2024-predictions-opta-supercomputer/
- https://theanalyst.com/eu/2022/08/opta-power-rankings-explained/
- https://statsbomb.com/articles/soccer/what-is-expected-goals-xg/
- https://www.statsperform.com/press/stats-perform-extends-official-data-partnership-with-uefa-until-2028/
- https://www.tandfonline.com/doi/abs/10.1198/016214506000001437
- https://developers.google.com/machine-learning/calibration/intro
- https://www.fundedplays.com/challenges
- https://www.statsperform.com/products/opta-vision/
- https://theanalyst.com/articles/opta-football-predictions
- https://arxiv.org/html/2605.16066v1
- https://www.fundedplays.com
- https://www.fundedplays.com/blogs
- https://www.fundedplays.com/blogs/how-fundedplays-evaluations-work