

Quick verdict and how to use this guide
What this article will and will not do
Short verdict, conditional: using current-season Net Rating and same-day availability will usually yield a clear lean for one side, but any final dallas mavericks prediction depends on the exact Team Advanced snapshot and the NBA Official Injury Report for the game day.
This article does not promise certainty or offer odds. It shows a reproducible method you can run in minutes, and it insists you declare the inputs and assumptions you used when publishing a pick. For the live team metrics you'll need the NBA.com Team Advanced tables and for availability the league's consolidated report, which together supply the core inputs for an objective forecast NBA.com Team Advanced
How to apply the model to one game (dallas mavericks prediction)
Use the following steps to turn public, league-defined metrics into a single-game probability: record the relevant Team Advanced values for each team, check the NBA Official Injury Report for confirmed absences, apply conservative minutes-based adjustments for starters or heavy-minute rotation changes, add a home-court modifier and rest adjustment, then translate the adjusted NetRtg differential into a win probability using the conversion method described later in this guide.
Before you publish any pick, state the season window you used (last 10, season-to-date, or opponent-adjusted), list who is questionable or out, and note any rest or travel concerns that influenced your modifiers.

What NBA advanced metrics mean for a matchup
Offensive, defensive and net ratings
The core comparison starts with Offensive Rating, Defensive Rating and Net Rating, which the league defines and maintains in its glossary; Net Rating, the difference between points scored and allowed per 100 possessions, is the single most useful baseline for comparing team strength on a neutral basis NBA Stats Glossary
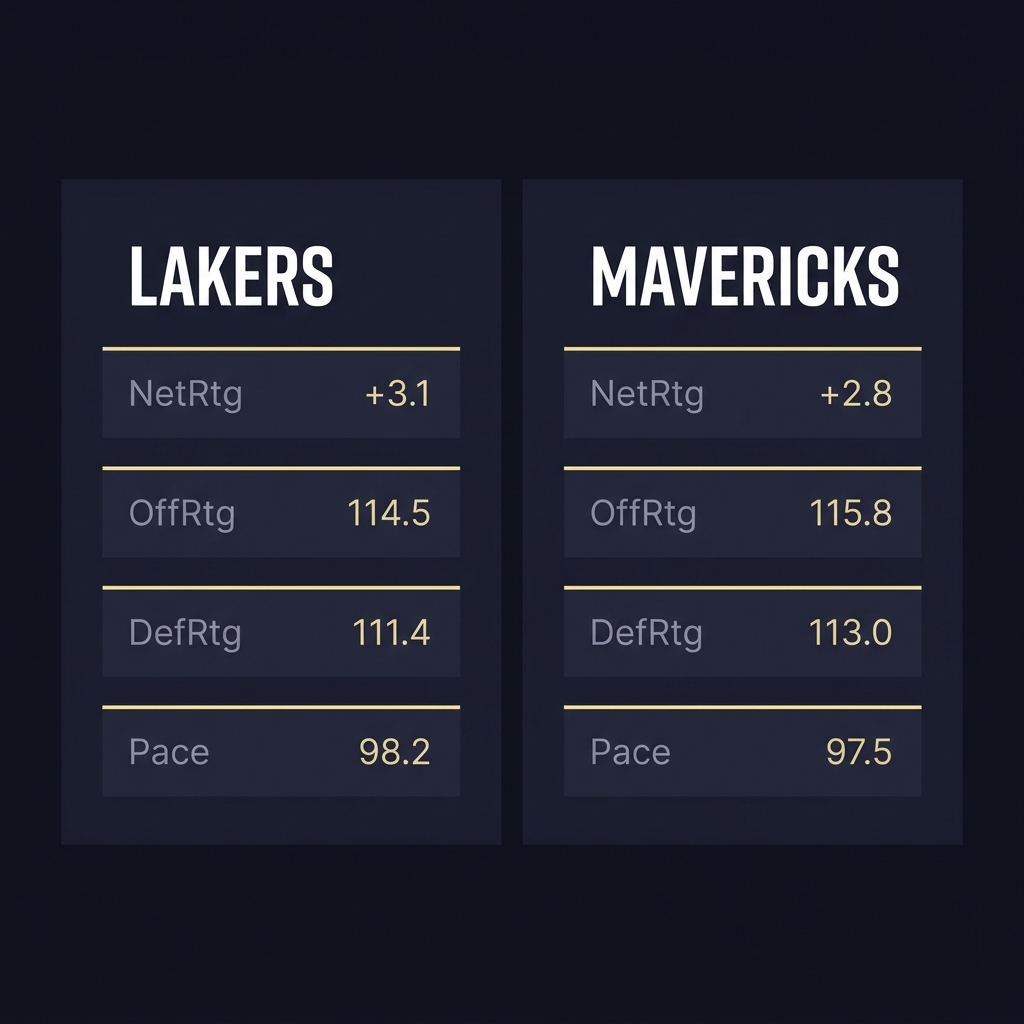
Interpreting these numbers practically means treating Net Rating as an expected margin per 100 possessions. When two teams differ by several points of NetRtg, that gap is a clear signal, but you must still adjust for availability and context before declaring a pick.
Four Factors and pace
The Four Factors-effective field goal percentage, turnover rate, offensive rebound rate, and free-throw rate-explain why Net Rating looks the way it does and identify matchup edges you should weight in adjustments.
Pace matters because Net Rating is per 100 possessions: a high-pace game multiplies the expected scoring swing, while a low-pace matchup reduces raw point variance. Normalize comparisons by thinking in per-100-possession terms, not raw points, so your adjusted NetRtg maps sensibly to expected scoring differential.

Recent team context: roster, form, and historical touchpoints
2024 Finals context and its relevance
Dallas' run to the 2024 NBA Finals, where they lost to Boston, demonstrates the franchise's contender-level ceiling entering the mid-2020s and is useful context when judging organizational depth and postseason experience Celtics win 2024 NBA championship
That Finals result should not be treated as a predictive override for a 2026 single game; use it as context about ceiling and pressure-handling rather than as a substitute for current-season Net Rating and availability.
Head-to-head trends and limitations
Head-to-head records add texture about matchup tendencies, such as which team wins more in certain venues or rotations, but they should not dominate a single-game model because rosters and rotations change year to year Dallas Mavericks head-to-head records
When a head-to-head trend aligns with current-season advanced metrics it is reinforcing. When it conflicts, trust the live Team Advanced numbers and availability more than historical narrative.
Get live Team Advanced and injury data before lock
Pull the current Team Advanced snapshot and the NBA Official Injury Report for both teams now before you proceed; the pick below only works with fresh inputs.
Pulling the live numbers: using NBA.com Team Advanced tables
Which season window and splits to choose
On NBA.com, choose the Team Advanced table and set the season window that matches your model intent: last 10 games for momentum, season-to-date for stability, and opponent-adjusted or split views for matchup-specific detail. The Team Advanced view lets you compare like-for-like fields such as NetRtg, OffRtg, and DefRtg Team Advanced | Stats
Record the same window for both teams so the comparison is apples-to-apples. If you expect rotation changes, favor shorter windows to capture form, but note the added volatility in the estimate.
Exporting and comparing Lakers and Mavericks side-by-side
Use the table's export or compare features to pull NetRtg, OffRtg, DefRtg, eFG%, TOV%, ORB%, FT Rate, and Pace for both teams. Saving these values in a small spreadsheet makes adjustments transparent and repeatable.
Quick export fields to capture from NBA.com Team Advanced
Export or copy these values for both teams before adjustments
With your exported fields, compute the raw NetRtg differential and flag which Four Factors differ most; those are the vectors you will adjust if availability changes.
Game-day adjustments: injuries, minutes and availability
Reading the NBA Official Injury Report
The NBA Official Injury Report consolidates same-day player availability and designations; checking it is essential because a late confirmed absence changes expected rotations and efficiency in measurable ways NBA Official Injury Report
Treat the report as authoritative for who is likely to play, but remember that designations can change. Use the report to identify starters listed as out or probable and then translate that into minutes-impact assumptions for your model.
How to adjust NetRtg for likely absences
Start by estimating the minutes lost from the projected rotation when a starter is out. Scale the team NetRtg toward the replacement player's observed lineup or season-level impact. Do this conservatively and document the minutes assumptions you used.
For example, if a primary playmaker who normally logs heavy minutes is confirmed out, lean on the team's last-10 lineup data or season splits to estimate how NetRtg shifts when that player is off the floor; then record the adjusted NetRtg as your input to the win-probability step.
Contextual modifiers: home court, rest and travel
How to add home-court lifts to NetRtg
Home-court advantage should be applied as a net-rating lift because NetRtg is the consistent unit across teams. Apply a modest NetRtg uplift to the home team, and avoid inventing an exact number in public unless you cite a source; treat the lift conceptually and be transparent about the magnitude you chose.

When both teams are evenly rested, the home lift may be the tiebreaker. When rest or travel differentials exist, weigh those alongside the home-lift rather than compounding them without clear documentation.
Rest and back-to-back adjustments
Rest affects rotation usage and efficiency. Use the days-off metric to nudge NetRtg: teams on extra rest often get efficiency benefits, while back-to-back road games can depress performance. Adjustments should be directional and conservative, with the assumption logged alongside other inputs.
Flag tight travel schedules or time-zone swings as qualitative modifiers. When margins are small, these qualitative factors can flip a pick, so document them and keep changes modest to avoid overfitting.
A simple transparent model: NetRtg differential plus adjustments
Model outline and inputs
Inputs you must collect: Team NetRtg for the chosen season window, an injury-adjusted NetRtg for each team, a home-court modifier, and a rest modifier. When you run the model, list each input and its source so your decision is reproducible.
State which season window you used and which players you treated as unavailable. This guide requires you to declare those assumptions when presenting a numeric win probability so readers can replicate or contest your choice.
How to convert adjusted NetRtg to a win probability
After computing the adjusted NetRtg differential, convert it to a win probability using a logistic-style scaling or an empirically tuned table. The exact scaling parameter is a choice; state it clearly and treat the conversion as part of your model that can be refined with tracking data. See aggregated Net Rating rankings for context Net Rating rankings.
Remember that the final probability is conditional on your inputs. If you change the injury or rest assumptions, re-run the calculation and publish the new probability rather than treating the first output as definitive.
Decision criteria: when to favor the Mavericks or the Lakers
Clear thresholds and qualitative factors
Favor the team with a meaningful adjusted NetRtg advantage derived from a stable sample window rather than a volatile short-term spike. Use last-10 numbers to detect momentum but default to season-to-date when sample stability matters.
Look for convergence between the NetRtg differential and the Four Factors; when both point the same way the pick is more reliable. If they diverge, dig into why and consider whether a rotation or matchup quirk explains the difference.
When star availability overrides metrics
Star-level absences can trump otherwise robust metrics. Confirmed absences of a primary playmaker or defensive anchor should force a re-evaluation because those players often shift the expected on-court impact beyond what NetRtg alone captures 2023-24 All-NBA Teams announced
When a star is in doubt, be explicit about how you altered the minutes and efficiency assumptions and prefer conservative probability adjustments rather than dramatic swings.
Common mistakes and prediction traps to avoid
Over-weighting recent headlines or old rivalries
Avoid letting rivalry narratives or a single headline drive your pick. Head-to-head lore can bias you; instead, let current Team Advanced metrics and the injury report dominate the numerical input Dallas Mavericks head-to-head records
When a past matchup feels salient, check if the personnel and rotations are materially similar before using the historical result as evidence.
Misreading the injury report
Common errors include treating questionable as equivalent to out or failing to translate minutes loss into a NetRtg effect. Use the Official Injury Report to distinguish probable plays from likely scratches and adjust your model conservatively if a key player's status is unclear NBA Official Injury Report
Document late scratches and rerun the model if a status changes; small changes in minutes for high-impact players can alter the probability meaningfully.
Example scenarios: two matchday walk-throughs (baseline and injury-affected)
Baseline: both teams at near-full strength
Hypothetical inputs only: assume season-to-date NetRtg of Team A is +2.5 and Team B is -0.5, with both teams healthy. Follow these steps: 1) record NetRtg values from the chosen Team Advanced window, 2) apply no injury adjustments, 3) apply a home-court lift to the home team, and 4) convert the final NetRtg differential to a win probability using your chosen scaling. These placeholders are examples; they are not live data and are for method illustration only Team Advanced | Stats
When you run the math with current numbers, publish the exact inputs and the chosen scaling so others can reproduce your probability. Tracking each published pick over time is how you refine the conversion parameter and the size of home/rest adjustments.
Injury-affected: late scratch to a primary playmaker
Hypothetical: same base NetRtg values but the home team's primary playmaker, who averages heavy minutes, is a confirmed out. Steps: 1) estimate minutes lost from the starter, 2) estimate replacement-level minutes and expected efficiency delta using recent lineup splits or season averages, 3) shift the team's NetRtg toward the replacement profile, 4) reapply home and rest modifiers, and 5) recompute the win probability. This shows how a single confirmed absence can move a model from a lean to a clear pick NBA Stats Glossary
Always label these scenarios as hypothetical and rerun them with the live Team Advanced snapshot and the NBA Official Injury Report when making an actual dallas mavericks prediction.
Interpreting model output: from probability to a pick
When a probability margin is decisive
Use a rules-of-thumb threshold to separate confident picks from coin-flips. A wide adjusted NetRtg advantage that survives robustness checks across windows and that aligns with the Four Factors and availability is a good candidate for a decisive pick.
If the margin is modest and sensitive to small injuries or rest changes, label the choice as a lean and include a margin-of-error statement so readers understand the fragility of the forecast.
How to express uncertainty
Publish the pick with a short assumption block: season window, players out/questionable, home/rest status, and the conversion parameter you used. That transparency helps others evaluate your process and lets you learn from outcomes.
Track outcomes against your assumptions over many games to see whether your adjustments are calibrated or need systematic tuning.
How a FundedPlays-style challenge benefits disciplined predictors
Testing a repeatable process over many games
A structured evaluation format that requires declared inputs and repeatable rules helps separate skill from luck by enforcing consistent documentation and outcome tracking over many matchups.
Using a repeatable process reduces emotional reactions to single outcomes and makes it easier to measure whether the predictive method is improving with iteration. See our blogs for examples of structured evaluation formats.
Using structured evaluations to measure skill
Track the model inputs, your published probabilities, and the actual outcomes. Over a large sample, compare expected wins to realized wins to measure calibration and to identify biases in your injury, home, or rest adjustments. A practical write-up of this approach is available here.
Remember that participation in any challenge should be responsible and framed as skill-testing rather than a guaranteed source of earnings, and that past success does not guarantee future results. For more on participation details visit Funded Plays.
Clear matchday checklist and parting advice
Five things to verify before you publish a pick
Run this five-item checklist just before lock: 1) current Team Advanced snapshot for the chosen window, 2) NBA Official Injury Report confirmation, 3) home-court and rest check, 4) declared assumptions logged alongside the published probability, and 5) record-keeping step to save inputs and outcomes for future calibration Team Advanced | Stats
Use the checklist to avoid impulsive changes and to ensure every pick is reproducible from its documented inputs.
The better team depends on current-season Net Rating, same-day player availability, and contextual modifiers such as home-court and rest; apply the reproducible NetRtg differential model with declared assumptions to produce a defensible pick.
Final reminders about assumptions
Be conservative with injury adjustments, prefer transparency, and keep your scaling parameter fixed until you have enough tracked results to justify changing it. Avoid overconfidence, and treat each published pick as an experiment you can learn from.
Good record-keeping and disciplined reassessment of assumptions are the practical ways to improve long-term predictive performance.
Use last-10 for momentum and season-to-date for stability; choose opponent-adjusted or splits if matchup-specific effects are important and state your choice when publishing a pick.
Treat questionable as uncertain, make a conservative minutes-impact assumption, and rerun your model if the player's status changes to probable or out before lock.
No. Star reputations provide context, but current Team Advanced metrics and same-day availability should drive single-game probabilities.