

What it means to convert odds to probability, quick definitions and intuition
Odds and probability are two ways to describe the same chance, but they use different scales. To convert odds to probability you take the odds, divide by one plus the odds, and that yields a value between zero and one that readers understand as a probability; this mapping is the inverse-logit or logistic transform and is implemented directly in statistical software R plogis documentation. See also a short note on probability, log-odds, and odds Montana State notes.
In plain terms, an odds value of 1 means the probability is 0.5, odds less than 1 correspond to probabilities below 0.5, and odds greater than 1 correspond to probabilities above 0.5. Say the odds are 2, then the probability is 2 divided by 3, about 0.667; the logistic function is the standard way to make that conversion in analysis and reporting.
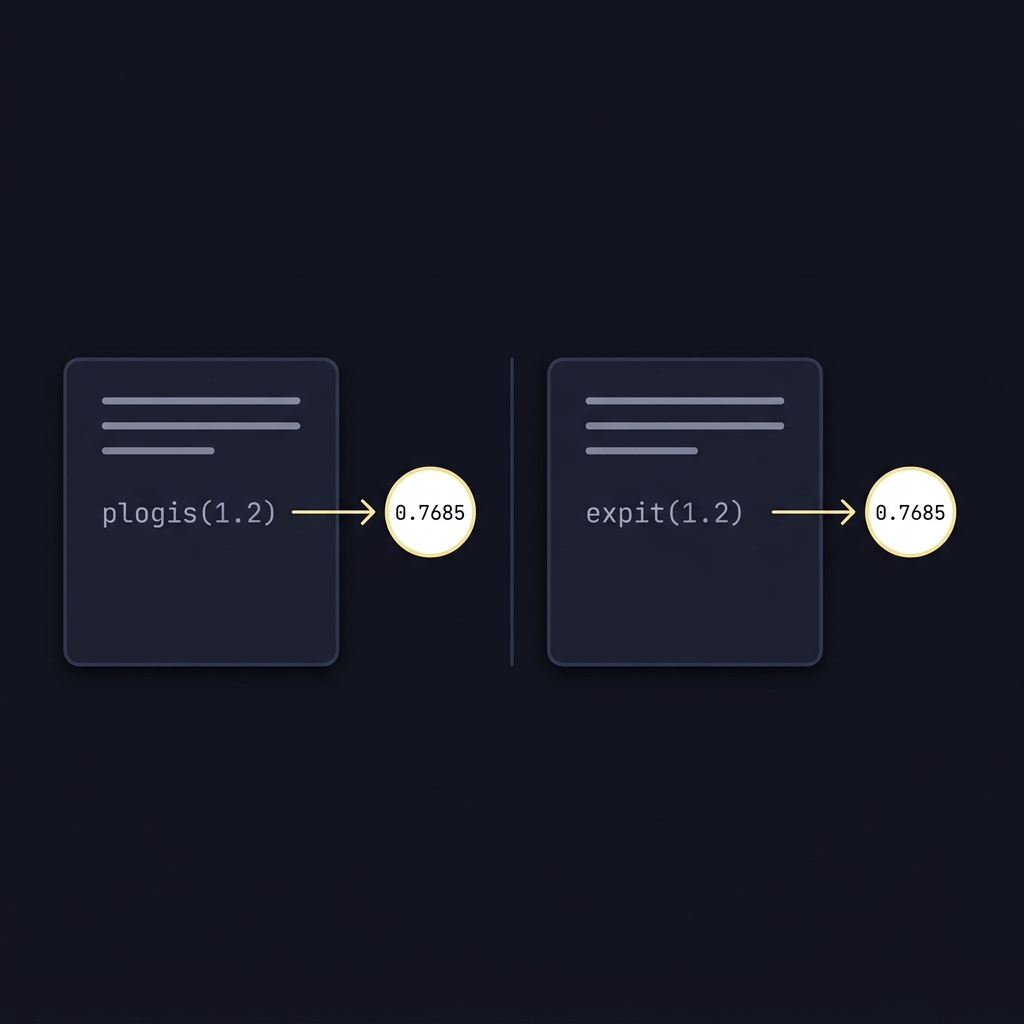
Recommend using plogis or expit for accurate mapping of odds to probabilities
Test with extreme values
Probability reports the chance directly on a zero to one scale, while odds compare the chance of the event versus no event. The odds equals probability divided by one minus probability, and using the inverse resolves that back to probability in a single step.
The logistic, or sigmoid, function smoothly maps any real-valued input into the 0 to 1 range used for probabilities. In practice this lets analysts convert linear predictors or odds into probabilities without leaving the valid range, and it has well-understood numerical implementations across statistical packages R plogis documentation.

Odds versus probability: plain-language comparison
Start with the definition odds = p / (1 - p). Rearranging gives odds times one minus p equals p. Expand and solve for p, and you obtain p = odds / (1 + odds), a compact formula you can use directly in spreadsheets or code. (see the easystats conversion guide easystats convert guide)
That algebraic step is the basis for the inverse-logit, so when you see the term inverse-logit or expit in software it implements the same mapping from odds or a linear predictor back to probability, but with routines that handle extreme values robustly scikit-learn logistic regression guide.
Why the logistic (sigmoid) function matters
Directly evaluating odds/(1 + odds) works for moderate values but can lose precision with extremely large or tiny inputs. Modern libraries provide numerically stable functions, like R's plogis and Python's expit or sigmoid, to avoid overflow and underflow and to return reliable probabilities across the full input range R plogis documentation.

For most practical problems you should prefer these built-in functions rather than hand-rolled algebra when converting model outputs to probabilities, because they are tested and optimized for edge cases.
The core math: convert odds to probability and the inverse-logit
Algebraic derivation of p = odds/(1 + odds)
Start with the definition odds = p / (1 - p). Rearranging gives odds times one minus p equals p. Expand and solve for p, and you obtain p = odds / (1 + odds), a compact formula you can use directly in spreadsheets or code.
That algebraic step is the basis for the inverse-logit, so when you see the term inverse-logit or expit in software it implements the same mapping from odds or a linear predictor back to probability, but with routines that handle extreme values robustly scikit-learn logistic regression guide.
How software implements the inverse-logit safely
Directly evaluating odds/(1 + odds) works for moderate values but can lose precision with extremely large or tiny inputs. Modern libraries provide numerically stable functions, like R's plogis and Python's expit or sigmoid, to avoid overflow and underflow and to return reliable probabilities across the full input range R plogis documentation.
For most practical problems you should prefer these built-in functions rather than hand-rolled algebra when converting model outputs to probabilities, because they are tested and optimized for edge cases.
How to turn an odds ratio into an absolute probability: the baseline formula
Derivation from a 2x2 table
An odds ratio compares the odds in a target group to the odds in a reference group. If the reference group has probability p0, its odds are p0 / (1 - p0). Multiply those reference odds by the odds ratio OR to get the target odds, then convert back to probability to obtain p1; method guidance for applying relative measures to a baseline is standard practice in evidence synthesis Cochrane Handbook chapter on effect measures.
Numbered steps: 1) take baseline p0 and compute baseline odds = p0 / (1 - p0). 2) compute target odds = OR times baseline odds. 3) convert target odds to probability using p = odds / (1 + odds). The algebra simplifies to a single formula you can use directly.
The key formula p1 = (OR × p0) / (1 − p0 + OR × p0)
The combined expression reduces to p1 = (OR × p0) / (1 − p0 + OR × p0). Here p0 is the baseline probability, OR is the odds ratio, and p1 is the resulting absolute probability for the target group; this formula is the standard way to apply an odds ratio to a baseline risk when you want an absolute estimate JAMA discussion of correcting the odds ratio.
Try the conversion with your own baseline
Try the worked examples below with your own plausible baseline p0 to see how absolute probabilities change with the same odds ratio.
It is important to document the chosen p0 when presenting p1 because different baseline values produce different absolute risks even for the same OR, and guidance recommends showing results across plausible baselines rather than a single unreferenced number Cochrane Handbook chapter on effect measures.
Why an odds ratio is not the same as a risk ratio, and when that matters
How OR and RR diverge as outcomes become common
An odds ratio approximates a risk ratio when outcomes are rare, but as the baseline probability grows the OR diverges from the RR and typically overstates the relative increase. This divergence is a common source of misunderstanding in reports and press summaries and has been highlighted in the method literature BMJ guidance on converting odds ratios.

When communicating results, prefer either reporting the risk ratio when it is appropriate, or converting the OR to absolute probabilities using transparent baselines so stakeholders see the real-world change in risk rather than an inflated relative figure. See the Funded Plays blog for examples Funded Plays blog.
Implications for interpretation and reporting
Because ORs can exaggerate effects for common outcomes, analysts should avoid equating an OR with a relative risk in plain-language summaries. Instead, show absolute probabilities calculated from a justified baseline or present both relative and absolute measures to keep interpretation grounded.
Odds ratios in logistic regression: why the OR alone cannot give you a probability
exp(beta) is an OR - what else you need
In a logistic regression model the exponentiated coefficient exp(beta) equals an odds ratio for a one-unit change in the predictor, but that value alone does not provide an absolute probability. To produce a probability you also need the model intercept and the values of all covariates to form the linear predictor, and then you apply the inverse-logit to that predictor to get p scikit-learn logistic regression guide.
The correct workflow is to construct the linear predictor eta = intercept + sum(beta_i * x_i) for the covariate pattern of interest, then compute p = plogis(eta) or its equivalent; converting a lone OR without this context will not yield a valid absolute probability.
Recovering absolute probabilities from the full linear predictor
Practical steps include extracting the intercept and coefficients from the fitted model, choosing covariate values for the scenario you want to report, computing eta, and then mapping eta to a probability using a stable inverse-logit routine. This approach produces predicted probabilities that reflect both relative effects and baseline risk encoded by the intercept.
Step-by-step examples: compute probabilities from an OR with different baseline risks
Small, medium and large baseline examples and interpretation
The following calculations are hypothetical and intended for learning. Example 1, low baseline: let p0 = 0.01 (1 percent) and OR = 2.0. Apply p1 = (OR * p0) / (1 - p0 + OR * p0). Plugging in yields p1 = (2 * 0.01) / (0.99 + 0.02) = 0.02 / 1.01, about 0.0198, which is an increase of roughly 0.9 percentage points on the absolute scale.
Example 2, medium baseline: let p0 = 0.10 (10 percent) and OR = 2.0. Using the same formula yields p1 = (2 * 0.10) / (0.90 + 0.20) = 0.20 / 1.10, about 0.1818, an absolute increase of about 8.18 percentage points. The same OR produces a larger absolute change when p0 is larger.
Example 3, large baseline: let p0 = 0.40 and OR = 2.0. Compute p1 = (2 * 0.40) / (0.60 + 0.80) = 0.80 / 1.40, about 0.5714, which is an absolute change of 17.14 percentage points. These hypothetical examples show how the same OR maps to differing absolute effects depending on baseline risk, consistent with guidance on applying relative measures to a plausible baseline Cochrane Handbook chapter on effect measures.
How the same OR produces different absolute effects depending on p0
Interpreting an odds ratio without reference to p0 hides this dependency. To communicate clearly, present p1 alongside the baseline and consider a small set of plausible baselines, for example a low, typical, and high scenario, so readers see a range of realistic absolute outcomes rather than a single, context-free relative effect.
Practical computation: recommended R and Python routines
R: using plogis and built-in stability features
In R use plogis to map a linear predictor or odds to a probability; it implements the logistic distribution function and handles extreme values numerically stably, which is why it is the recommended routine when converting model outputs to probabilities R plogis documentation. See the CRAN vignette for additional guidance CRAN vignette.
When you need to convert an odds ratio to an absolute probability in R, compute the baseline odds, multiply by the OR to get target odds, and either apply odds/(1+odds) directly or feed the log-odds to plogis for the same result with added numerical safety. (see how Funded Plays evaluations work how Funded Plays evaluations work)
Apply the odds ratio to a clear baseline probability using p1 = (OR × p0) / (1 − p0 + OR × p0), or compute predicted probabilities from a fitted logistic model by forming the linear predictor and applying the inverse-logit function.
Python users can rely on scipy.special.expit or the logistic tools in scikit-learn to perform the inverse-logit mapping, and these functions are suitable for pipelines that produce predicted probabilities from fitted models scikit-learn logistic regression guide.
As a minimal checklist for code: include the intercept, set covariate values explicitly, compute the linear predictor or baseline odds as appropriate, then call plogis or expit to obtain probabilities for reporting.
Python: using scipy.special.expit or scikit-learn pipelines
Scipy's expit and scikit-learn's predict_proba are common choices for converting linear predictors to probabilities in Python workflows. These functions are numerically robust and integrate well with model pipelines for reproducible prediction.
When automating reports, save the code used for conversion and the chosen baseline values alongside figures and tables so readers can reproduce absolute probability numbers exactly.
How to choose and transparently report a baseline probability
Sources for plausible baseline risks
Reasonable sources for p0 include the observed incidence in the study's control group, registry or surveillance rates for the population of interest, or prior study estimates that match your target population. Cite and document whichever source you use so consumers of your analysis can judge plausibility.
When a single best baseline is uncertain, present a range of p1 values computed from low, typical, and high plausible baselines and label them clearly, so readers understand the sensitivity of absolute effects to baseline choice Cochrane Handbook chapter on effect measures. See the Funded Plays homepage for examples Funded Plays.
Reporting a range and communicating uncertainty
Include a short methods note or figure caption that states the baseline values used for conversion, the formula or code function applied, and an explanation that the reported p1 values are conditional on those baselines. This practice makes the assumptions transparent and reproducible.
For stakeholder-facing summaries, use plain language to say how absolute risk changes under each plausible baseline rather than relying on relative language that can mislead when the outcome is common.
Common mistakes, pitfalls and communication tips
Mistakes to avoid when reporting OR-derived probabilities
Do not treat an odds ratio as a risk ratio in summaries, and do not report ORs without also stating or converting to an explicit baseline risk; both practices risk overstating effects and confusing readers BMJ guidance on converting odds ratios.
Avoid presenting a single p1 without documenting p0, and do not omit the model intercept when converting model-derived ORs to predicted probabilities.
Plain-language framing for audiences
Use clear phrasing such as, If the baseline risk is X, the absolute risk would be Y under the reported odds ratio, and provide a short range for low-to-high baselines. This framing keeps statements factual and limits overinterpretation.
Two ready-to-use templates: Template A, Technical: Absolute risk in the target group is p1, calculated from baseline p0 using the OR. Template B, Plain: If we start from a baseline of X percent, the risk would be about Y percent given the same odds ratio.
Quick checklist for analysts: from OR to reported probability
State the baseline p0 used for conversion and justify its source. Report the OR and show the exact formula or code for conversion. Save and publish the code or scripted calculation so results are reproducible Cochrane Handbook chapter on effect measures.
Show a plausible range of p1 values using low, typical, and high baselines. Note sensitivity to baseline choice and prefer absolute differences in communication when audiences are non-technical.
Summary: key takeaways and recommended next steps
Core formulas to remember: p = odds / (1 + odds) for a direct odds to probability conversion, and p1 = (OR × p0) / (1 − p0 + OR × p0) to apply an odds ratio to a baseline probability. Use built-in inverse-logit routines like plogis or expit for numerical stability R plogis documentation.
When you report results, always state the baseline you used and consider presenting a small range of plausible baselines so stakeholders can see how absolute probabilities change. Next steps are to compute p1 for the baselines most relevant to your question and save the conversion code alongside your figures and tables for reproducibility.
Yes. An odds ratio alone cannot produce an absolute probability; you must apply it to a baseline probability p0 to compute p1 using the standard formula.
No. Odds ratios can substantially differ from risk ratios when outcomes are common, so avoid treating an OR as an RR without correction or context.
Use R's plogis or Python's scipy.special.expit (or scikit-learn predict_proba) to compute probabilities from log-odds or odds safely.
References
- https://stat.ethz.ch/R-manual/R-release/library/stats/html/plogis.html
- https://www.montana.edu/rotella/documents/502/Prob_odds_log-odds.pdf
- https://scikit-learn.org/stable/modules/linear_model.html#logistic-regression
- https://easystats.github.io/effectsize/articles/convert_p_OR_RR.html
- https://pubmed.ncbi.nlm.nih.gov/9832001/
- https://training.cochrane.org/handbook/current/chapter-06
- https://www.bmj.com/content/348/bmj.f7450
- https://www.fundedplays.com/challenges
- https://cran.r-project.org/web/packages/effectsize/vignettes/convert_p_OR_RR.html
- https://www.fundedplays.com
- https://www.fundedplays.com/blogs
- https://www.fundedplays.com/blogs/how-fundedplays-evaluations-work