
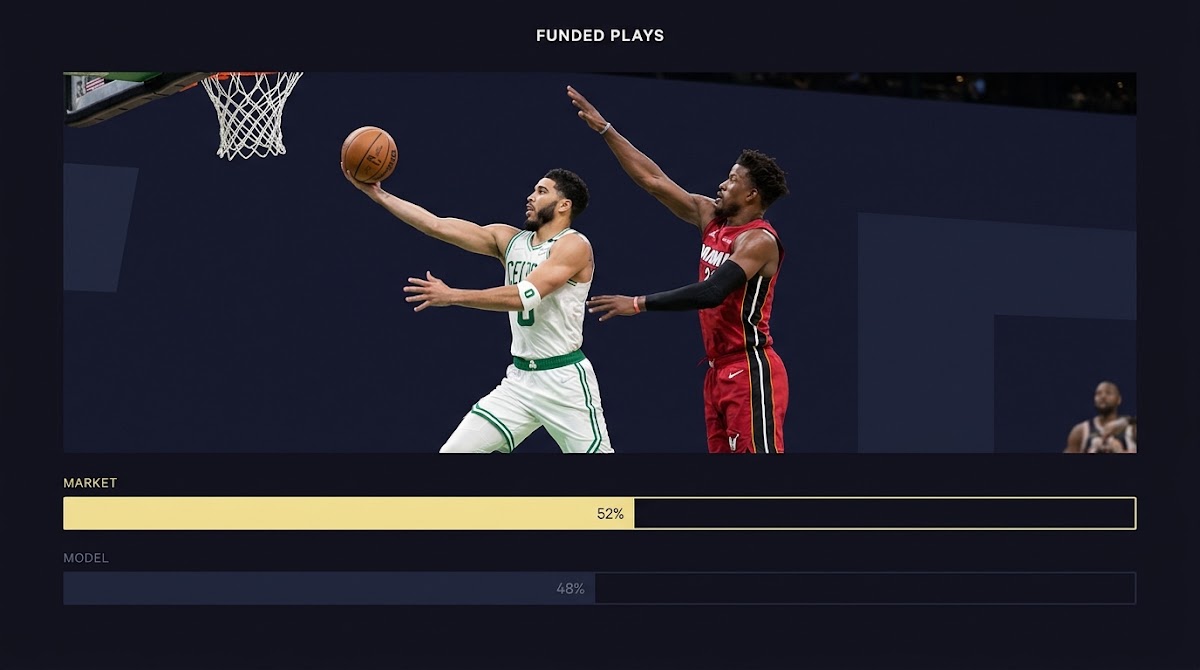
Quick pregame verdict: celtics heat predictions in one line
Short answer, with a clear caveat: based on market-implied odds and a typical alignment of independent predictive models, the Celtics are most often the pregame favorite versus the Heat, but that designation is provisional and can flip with same-day injuries or late market moves
That one-line verdict combines two inputs readers can verify quickly: market odds converted to implied win probability and a model-based comparator, which together usually identify a short pregame favorite; for an explanation of how to convert odds into an implied chance see Investopedia's explanation of implied probability Investopedia implied probability
Learn how FundedPlays Challenges structure sports prediction evaluation
Keep reading for the step-by-step checks that turn that provisional line into a defensible pregame call
How market odds translate into implied win probability
Bookmakers publish moneylines and spreads to show both a market view of outcome likelihood and a pricing structure that balances action. Converting an American moneyline into an implied win probability is a standard way to quantify who the market favors before adjusting for the bookmaker's margin
For a quick refresher on conversion formulas, consult Investopedia's practical guide to implied probability which shows the standard approach to move from moneyline odds to a percentage representation of win chance Investopedia implied probability
At a high level, positive moneylines use one formula and negative moneylines use another, with the goal of producing a base probability for each side. After you run those values you will usually observe that the two implied probabilities sum to more than 100 percent because the book includes a margin, commonly called vig
Normalizing for the vig is straightforward: divide each implied probability by the sum of both implied probabilities, then rescale so the two add to 100 percent. That normalization gives you the market's implied win probabilities net of bookmaker margin, which you can then compare to model outputs

Model projections: what independent predictors say about Celtics-Heat
Independent models typically rely on power ratings, recent results, schedule adjustments, and historical matchup effects to produce a pregame probability for each team. TeamRankings publishes a description of its prediction methodology that explains the kind of factors a transparent model uses to generate those probabilities TeamRankings prediction methodology
Use the market as the consensus price and models as a comparator; if they align you have higher confidence, if they diverge check the official injury report and matchup context before deciding
Reading model outputs is about interpreting probability as a calibrated expectation, not a guarantee. A model like TeamRankings or an approach using BPI-style ratings will output a win probability that reflects season-long strengths and short-term form; those outputs are useful comparators versus market odds, especially when both signals point the same way
Keep in mind models run on the data available at the time of the run. If a model snapshot predates a late injury or a new minute restriction, its probability may lag the market until the model is refreshed
Why the NBA official injury report matters for predictions
The NBA official injury report is the authoritative baseline for day-of availability and participation designations, and it is the standard source pro handicappers check before adjusting rotation assumptions NBA official injury report
Participation tags like probable or out carry practical rotation implications. A probable listing for a high-usage starter suggests the team expects the player to play but may carry minute protections that reduce their usual load; an out designation normally implies a roster change to the rotation that can swing both market odds and model projections
Markets often move quickly on late injury news, and models that refresh after the report will typically fold those status changes into new probabilities. That makes the official injury report the day-of source you should verify before locking a call
Key matchups that typically swing Celtics-Heat games
Matchup edges matter in this rivalry because individual defenders and rotation depth can shift game flow. Key areas to watch are backcourt handling and primary perimeter defense, frontcourt scoring and rim protection, bench depth and secondary scoring, and rebound control on both ends
For example, a favorable backcourt matchup where one team can limit the primary ball-handler's creation can reduce expected points generated from pick-and-roll or transition. Similarly, a clear advantage in frontcourt scoring can force switches that open perimeter looks or drive-and-kick opportunities

When a key starter is downgraded to probable or ruled out, the matchup picture changes quickly; bench depth and the quality of role minutes become more influential than pregame reputations
A step-by-step pregame framework to form your own prediction
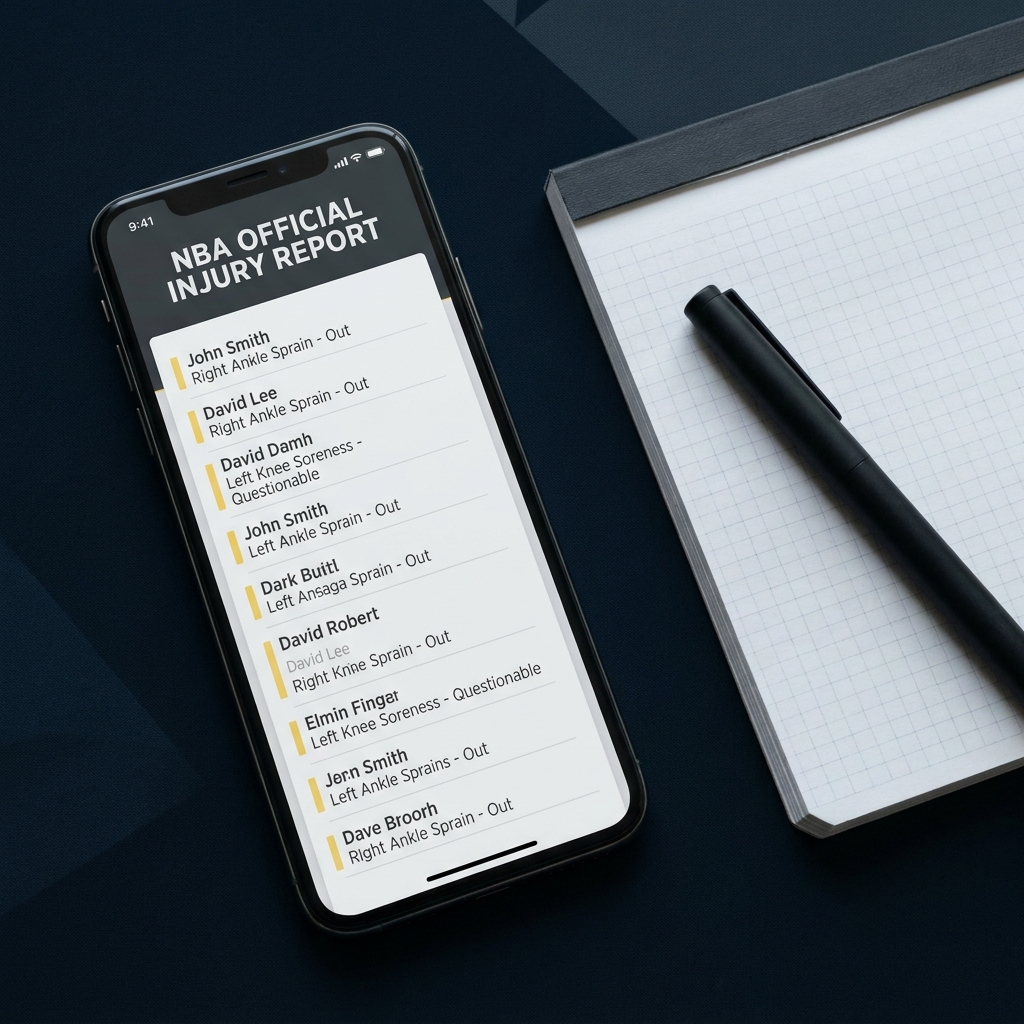
Use this ordered checklist before tip-off: 1. Check market odds and convert to implied win probability. 2. Consult at least one independent model to see model probability. 3. Verify the NBA official injury report for each team's status. 4. Assess key matchups and minute protections. 5. Form a provisional verdict that remains flexible until final confirmations
When inputs disagree, apply weights: give immediate priority to same-day official injury information, treat market-implied probability as the consensus price, and use models as a reality check that points out structural advantages or hidden edges. If a key player is questionable, raise the weight of rotation and matchup analysis accordingly
Document your provisional call with the timestamped market odds, model snapshot time, and the injury report status so you can review outcomes and refine your approach over time (see how our evaluations work)
Decision criteria: when to trust the market, the model, or your edge
Simple rules help resolve conflicts. If market and model agree within a few percentage points, treat that as consensus and default to the market price. If they diverge materially, identify why: is the market moving on fresh injury news, or is the model flagging a structural advantage that the market has not priced?
Red flags that reduce confidence include late scratches announced within the hour before tip-off, ambiguous minute restrictions listed on the injury report, or rapid market movement without clear public reasoning. In those cases, adopt a conservative stance or delay a final call until the information settles
Compare market and model alignment before a provisional call
Log timestamps for each input
Common mistakes and traps in Celtics-Heat predictions
Overreacting to small sample stats, like a two-game hot streak, can mislead. Corrective action: average performance over a larger recent window before adjusting probabilities
Ignoring minute reductions and rest plans is another frequent error because a starter playing fewer minutes can change expected lineup production. Corrective action: convert participation tags into minute assumptions and rerun your matchup assessment
Double-counting team reputation causes bias, for example treating a prior championship as a persistent edge that overrides current injuries. Corrective action: use championships and rankings as priors, not as decisive evidence for a single game
M misreading injury designations by treating probable as certain can be costly. Corrective action: treat probable as uncertain and reduce the expected impact proportionally until final confirmation
Worked example: reading market odds, model output and the injury report for a recent Celtics-Heat game
Use the April 21, 2024 Celtics-Heat game as an illustrative study because public model outputs and game summaries from that date show how model and market perspectives can be compared; see the ESPN game summary for that date as an example of a BPI-style matchup presentation ESPN game summary from April 21, 2024
In a stepwise application you would have first converted the opening moneyline into an implied probability, then recorded the model snapshot and the official injury report. From the ESPN Matchup Predictor and a TeamRankings-style model snapshot you can compare whether the model favored the same team the market did
Next, map any injury report entries to rotation impact. If a primary guard was downgraded, measure typical minutes replaced by the backup and adjust your expected lineup efficiency. If the injury report showed probable for a starter, treat that as a conditional change and monitor late confirmations
Finally, form a provisional verdict using the checklist rules: if market and model agreed, accept the consensus as the pregame favorite; if they diverged, apply your matchup and rotation adjustments and lower conviction if late information remained uncertain
How to calculate implied probability yourself: a short how-to
After you calculate each side's implied probability, normalize for the bookmaker margin by dividing each raw implied probability by the sum of both raw implied probabilities, then multiply by 100 to get normalized probabilities that sum to 100 percent

Keep this short copy-paste friendly method handy when you want to confirm a market favorite numerically before comparing to model outputs or injury-driven adjustments
Using published model outputs (TeamRankings, BPI) without over-relying on them
Published models add value by offering a repeatable, data-driven perspective on win expectancy. See our blog for related posts. TeamRankings documents its prediction approach in public-facing material, which helps users understand why a model might favor one team over another TeamRankings prediction methodology
ESPN's BPI Matchup Predictor is a familiar example of how model output is presented for individual games, and its April 2024 Celtics-Heat pages illustrate how model probability appears alongside market context ESPN game summary from April 21, 2024 and you can also consult ESPN's injury status page ESPN injury status
Model limitations to watch for include late injuries that are not yet reflected in a snapshot, minute restrictions that models do not capture, and matchup-specific coaching decisions. Treat models as one strong input among several, not a sole oracle
Context matters: Celtics recent form and why the 2024 title still matters
Boston captured the 2024 NBA championship, which supplies a reasonable prior about organizational depth, continuity, and winning culture when assessing future matchups NBA.com championship recap
During the 2024-25 season, NBA.com Power Rankings repeatedly placed Boston near the top of the league, which is further evidence the team entered the mid-2020s as a consistent top performer NBA.com Power Rankings
Those signals are useful as priors, but they should not swamp day-of information. Treat championships and power rankings as background context that informs, rather than determines, a single-game pregame call
Pre-tip-off checklist: five things to confirm before finalizing your call
Confirm these five items in the final hour before lock: 1. Last official injury report check for both teams. 2. Starter confirmations from team announcements. 3. Any listed minute protections or load management notes. 4. Market movement since open and current moneyline. 5. Model refresh timestamp and snapshot time
If any item fails a sanity check, either reduce your stake, delay the final call, or abstain until the information clears. A provisional call is acceptable as long as you record the inputs and remain ready to adjust once tip-off information is final. Cross-check the NBA official report NBA injury report page and other trackers such as CBSSports injuries before lock
Conclusion: a balanced, data-first approach to Celtics-Heat predictions
Key takeaway: form a provisional celtics heat prediction by combining market-implied probability, a model comparator, the NBA official injury report, and matchup assessment in that order of verification. Use the pre-tip-off checklist to confirm final statuses before lock
Where to go from here: document your calls and outcomes, monitor model refreshes and injury reports on game day, and check Funded Plays for tools and resources
Use the standard moneyline formulas: for a positive moneyline M compute 100 divided by M plus 100, for a negative moneyline M compute negative M divided by negative M plus 100, then normalize both probabilities to remove vig
Treat the market as the consensus price and models as a structured comparator; if they align, confidence is higher, if they diverge investigate injuries or late news and weight accordingly
Confirm the official injury report, check starter confirmations and minute protections, note market movement since open, and verify the model snapshot timestamp
References
- https://www.investopedia.com/terms/i/implied-probability.asp
- https://www.teamrankings.com/nba/about
- https://official.nba.com/injury-report/
- https://www.fundedplays.com/challenges
- https://www.espn.com/nba/game/_/gameId/401585917
- https://www.nba.com/news/celtics-capture-18th-nba-championship-2024
- https://www.nba.com/news/power-rankings-2024-25-week-10
- https://www.fundedplays.com
- https://www.fundedplays.com/blogs
- https://www.fundedplays.com/blogs/how-fundedplays-evaluations-work
- https://official.nba.com/nba-injury-report-2025-26-season/
- https://www.espn.com/nba/injuries
- https://www.cbssports.com/nba/injuries/