

Quick bucks prediction: who is favored in Bucks vs Wizards matchups?
Short verdict: based on the 2025-26 season indicators, the Milwaukee Bucks are generally the favored team in matchups with the Washington Wizards, though final status depends on game-day availability and lines. This bucks prediction reflects season-long tiering and efficiency differences rather than a single-game guarantee.
Why that lean exists: late-season power rankings consistently placed Milwaukee above Washington, and team-level metrics from 2025-26 show a measurable gap in net rating and point differential, which together create a default expectation favoring Milwaukee NBA.com power rankings.
Convert a moneyline into an implied probability in percentage
Use as a quick reference not a market substitute
Quick reminder: check the official injury report and same-day line movement before acting, since late changes can flip a matchup view.
What the 2025-26 season data shows - context behind the prediction
Power rankings and competitive tiers provide a compact view of relative team standing across the season. In late 2025-26, public rankings placed Milwaukee in a higher competitive tier than Washington, which is a straightforward reason to start a pregame view leaning toward the Bucks NBA.com power rankings.
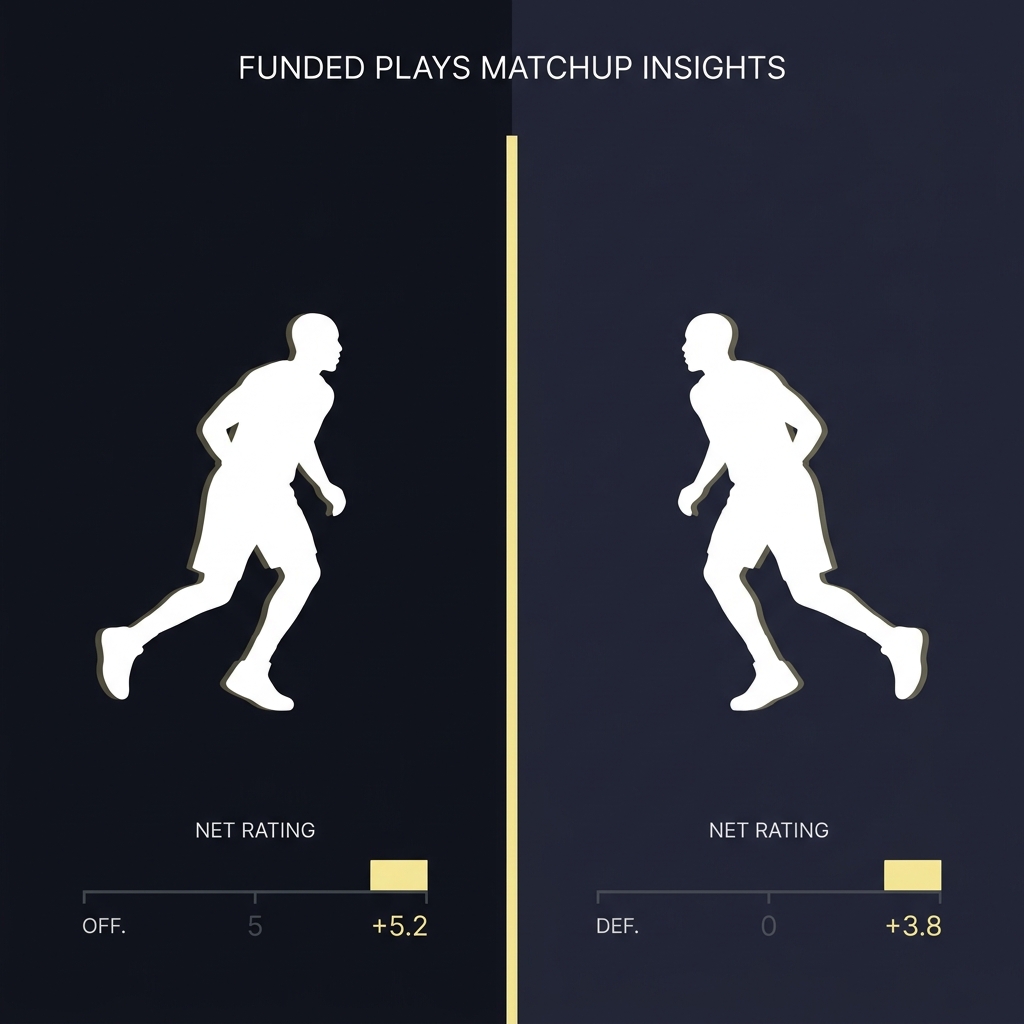
Season-long efficiency measures deepen that signal. Milwaukee finished the 2025-26 regular season with a positive point differential and net rating, while Washington’s season page shows a negative differential; that gap in underlying scoring and defense trends helps explain the typical market favoring Milwaukee Milwaukee Bucks team page.
Independent season summaries corroborate the basic picture. Basketball-Reference season pages for both teams reflect records and efficiency indicators consistent with the observed gap, which is useful when cross-checking headline metrics before a prediction Milwaukee season summary.
How predictive models and rankings turn data into a bucks prediction
What power rankings and BPI measure: public ranking systems and model frameworks convert team strength inputs such as net rating, roster stability, and schedule context into a single comparative metric; that translation makes it easier to compare teams across a season and is a core reason models favored Milwaukee in 2025-26 NBA.com power rankings.
How win probabilities are derived from team strength: models take those comparative metrics and adjust for venue, recent form, and situational context to output a probability estimate, which typically favors the higher-rated team and grows more pronounced when the favorite is at home.
Quick pregame check to confirm your view
Before you lock a pick, check the latest model outputs and the market line to make sure nothing material changed for the game.
Caveat: models are dynamic. They update when same-day information such as injury or rotation news arrives, so a model-based bucks prediction is a starting point that must be reconciled with last-minute availability.
Key matchup factors that commonly shift the line
Home-court advantage is a consistent mover of expected outcomes. When a higher-rated team plays at home, model probabilities and market lines usually widen in the favorite’s direction, which is one reason venue matters in a bucks prediction.
Travel and short rest can depress performance for either side, and markets price that into lines when schedule context is meaningful. Those schedule effects are often visible in the day-of efficiency snapshots used by models.
Matchup-specific strengths and weaknesses, such as comparative size, defensive assignments, or pace preferences, create scenarios where Washington can gain an edge despite season metrics; those matchup nuances interact with availability and model inputs rather than replacing the season signal.

Day-of-game essentials: injury report, line movement and late updates
How to read the NBA official injury report: the league report is the authoritative same-day source for player availability and assignment of game statuses, and checking it is the single most important routine before finalizing a prediction NBA official injury report.
Based on 2025-26 season data, the Milwaukee Bucks are generally favored, but check same-day availability and lines before acting.
Why late scratches change a bucks prediction: a last-minute absence by a starter or a rotation shift can materially alter matchup balance and win probability, and markets will often move quickly to reflect that new information; incorporate the reported change into both model inputs and your market read.
Reading the betting market vs model probabilities
Odds, implied probability and margin: a simple conversion turns a moneyline or spread into an implied probability, which helps compare a bookmaker’s view to a model’s output; use a calculator or the quick formula approach to see whether the market is offering value for your projected probability.
Public betting behavior and sharp money signals: lines move for a reason. Heavy public action can push a number away from pure model expectation, while professional or sharp money often moves a line earlier and may signal information or differing risk appetite that is worth noting before updating your bucks prediction.
Reconciling market signals and model outputs requires context. If a model and market disagree, look for explanatory factors such as the injury report, late rotations, or clear public bias rather than treating the discrepancy as decisive on its own.
Practical matchup scouting: where the Bucks usually hold the edge
Season strengths reflected in team stats: Milwaukee’s 2025-26 team page shows offensive and defensive balance contributing to a positive net rating, which is the kind of season-wide performance that translates into matchup advantages for the Bucks Milwaukee Bucks team page.

Areas Washington can exploit: Washington’s season metrics in 2025-26 included a negative point differential and efficiency indicators that often create vulnerabilities the opponent can target, but exact exploitation depends on rotations and the specific matchup plan Washington Wizards team page.
Always tie scouting conclusions to same-day availability. A rotation tweak or an unexpected starter appearance can change which team strengths matter most and how you interpret the statistical edge.
Common mistakes when making a bucks prediction
Ignoring same-day information is a frequent error. Skipping the official injury report or late rotation notes can turn a sound pregame view into a wrong decision once the lineup reality is known NBA official injury report.
Copying public lines without context means you accept someone else’s reasons rather than testing your model or edge. Instead, identify why a line moved and whether that reason is relevant to your projection.
Overweighting short-term runs or small samples causes overreaction. Use season metrics and model context to temper responses to brief streaks, and log each decision to separate luck from skill over time.
Scenario examples: how one headline change can flip a prediction
Template 1, favorite fully available: when both teams report their usual rotations and no starters are listed as questionable or out, the season-level metrics and rankings dominate and the default bucks prediction usually holds.
Template 2, key starter out: if a starter or primary rotation piece is scratched late, the matchup balance can shift dramatically and the favored side’s win probability may fall enough to reconsider the prediction; check the official injury report immediately and monitor lines for movement NBA official injury report.
Template 3, multiple rotation changes: when several role players are unavailable or the reported rotation is shortened, models and markets both adjust; in that situation, re-run a quick probability check and compare it to the available market to decide whether to act.
A short game-day checklist to finalize your bucks prediction
Five-step checklist: 1) Check the NBA official injury report, 2) confirm the probable line and market movement, 3) compare the market-implied probability to your model, 4) review travel and rest context, 5) verify any late rotation notes from team communications NBA official injury report.

What to lock and when to wait: act when your model probability meaningfully exceeds the market after accounting for injury and matchup context; wait when the margin is small or when late information is still arriving.
Discipline tip: log the reason for each pick and the outcome. Tracking decisions over time is how skill shows itself, and it supports iterative improvement without promising earnings.
How ranking outputs like BPI differ from market lines
Conceptual differences: models like BPI produce probability estimates from observable team strength inputs and situational adjustments, while market lines reflect price, risk management, and the flow of money; use models to form a baseline and markets to capture pricing dynamics NBA.com power rankings.
When models and markets disagree: common reasons include public bias, late injury uncertainty, or sharp money acting on information not reflected in headline metrics. Weight model outputs and market signals together and prefer the combined explanation that best fits available evidence.
Using a skill-challenge approach (FundedPlays) to practice making bucks predictions
How to build a practice discipline: use structured prediction challenges to test consistency by making repeated, documented picks using season metrics and same-day checks, and treat the virtual challenge as a controlled environment for learning decision discipline.
Tracking and learning from outcomes: log each prediction, the reasoning behind it, and the game-day inputs you used. Over time, review those records to separate strategic errors from variance and refine your process while acknowledging no outcome is guaranteed.
Concise conclusion: how to think about a bucks prediction for this matchup
Final takeaway: based on the 2025-26 power rankings and season efficiency indicators, Milwaukee would generally be favored over Washington, but that default view must be updated with same-day availability and line movement before making a final decision NBA.com power rankings.
One-sentence action: before you lock a pick, check the NBA official injury report and compare the market-implied probability to your model to confirm any edge NBA official injury report.
References and further reading
Sources used: NBA.com late-season power rankings NBA.com power rankings, Milwaukee Bucks 2025-26 team stats Milwaukee team page, Washington Wizards 2025-26 team stats Washington team page, the NBA official injury report NBA official injury report, and Basketball-Reference season summaries for Milwaukee and Washington Milwaukee season summary.
Check the NBA official injury report for game-day availability, then confirm market movement and model probability.
Season metrics form the baseline but can be overridden by same-day injuries, rotation changes, or market information.
Use structured challenges to log picks, reasons, and outcomes, then review results to separate skill from variance.
References
- https://www.nba.com/news/power-rankings-2025-26-week-24
- https://www.nba.com/stats/team/1610612749?Season=2025-26&SeasonType=Regular%20Season
- https://www.basketball-reference.com/teams/MIL/2026.html
- https://official.nba.com/nba-injury-report/
- https://www.nba.com/stats/team/1610612764?Season=2025-26&SeasonType=Regular%20Season
- https://www.fundedplays.com/challenges
- https://www.fundedplays.com/blogs/how-fundedplays-evaluations-work
- https://www.fundedplays.com/blogs
- https://www.fundedplays.com
- https://www.si.com/nba/bucks/onsi/gameday/milwaukee-bucks-washington-wizards-injury-report-betting-lines-how-to-watch-lineups-more-01kds5vz3y2k
- https://www.espn.com/nba/team/injuries/_/name/wsh/washington-wizards
- https://www.teamrankings.com/nba/matchup/bucks-wizards-2025-12-01/injuries