
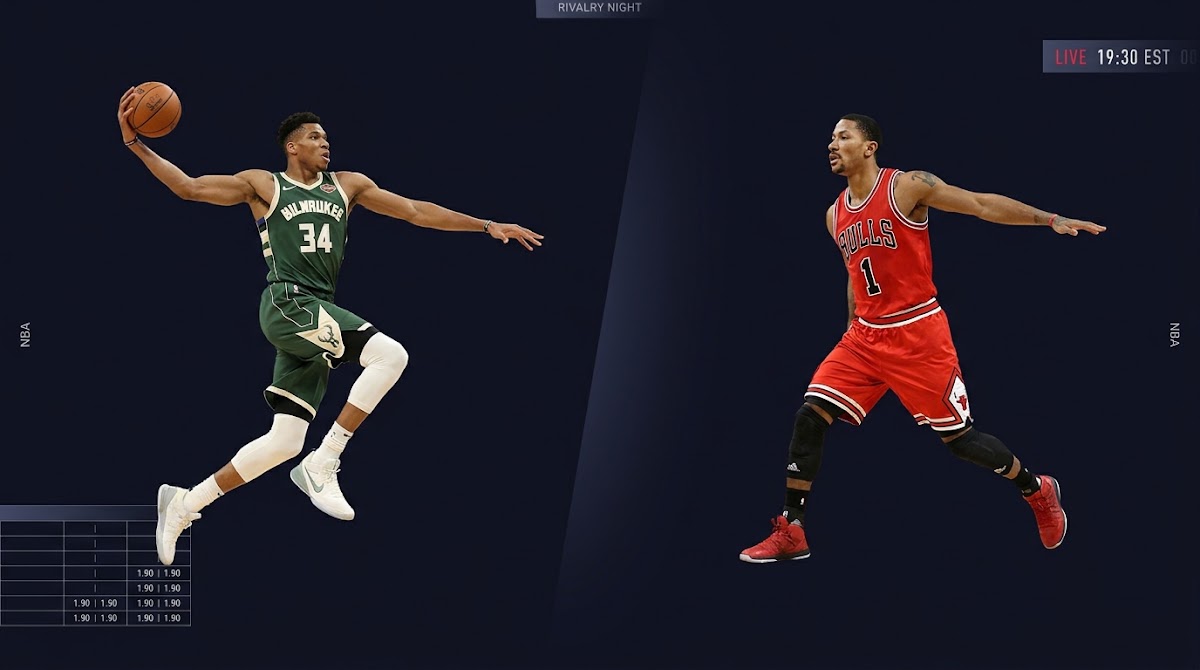
What it means to be "favored" in Bucks vs Bulls
How sportsbooks express favoritism: spread, moneyline, implied probability
When writers ask "who is favored to win Bucks vs Bulls" they are asking which side the market prices as more likely to win. That market view is typically expressed two ways, with a spread that reflects the expected margin and a moneyline that encodes the market favorite directly; converting American moneyline odds into implied probability is the standard route to see the market's percentage expectation, and the conversion method is well documented by industry references Implied probability: definition and conversion from American odds.
The spread and the moneyline are complementary signals. A spread tells you how many points a favorite is expected to win by, while the moneyline converts that signal into a stake-adjusted preference for bettors and market makers. Consensus odds pages aggregate lines across books so you can view the market-implied favorite as a single snapshot before you run any model NBA odds consensus board and sites such as Yahoo Sports.
Practice documented pregame challenges on FundedPlays
Try documenting a pregame workflow on FundedPlays as a practice challenge, using timestamped odds and the official injury report as your inputs.
Market odds represent collective, money-weighted information and are the natural starting point for a disciplined pick. Using the market-implied probability as a baseline helps you quantify any edge you think your model or read provides, instead of relying on intuition alone.
Reading those signals properly means knowing which market instrument to use for your decision. For a quick pick you may use the moneyline converted to implied probability. For a graded evaluation or a stake decision you may prefer the spread and a simulated hold model to weight potential returns and downside.

Key data to check on game day: official injury report and team efficiency
Where to find authoritative availability and why it matters
The authoritative source for player availability on game day is the NBA official daily injury report. That document is the primary source journalists and modelers use to confirm which starters and rotation players are active, and late entries or scratches can change lines quickly NBA official injury report.
Before finalizing a pick, check the injury report for both teams and note any listed questionable or out designations. Those tags can alter expected minutes allocations and offensive or defensive roles, which in turn change short-term efficiency inputs and the moneyline.
Which season metrics to pull from NBA.com/stats
Core team-strength inputs to pull from NBA.com/stats are net rating, offensive rating, defensive rating, and pace. These season-level metrics are standard inputs for lightweight pregame models because they summarize scoring margin, scoring efficiency, opponent efficiency, and game tempo in a compact set NBA team advanced stats.

Use those metrics to form a baseline model estimate for each team, then adjust for injuries and minutes. A team with a materially better net rating or a consistently higher offensive rating will generally be the more probable winner all else equal, but availability and matchup-specific defensive quirks can narrow or reverse that edge.
Convert moneyline to implied probability and compare to model benchmarks
Step-by-step conversion from American odds to implied probability
To convert an American moneyline into an implied win probability you follow the standard formula documented in odds references. That procedure turns the market moneyline into a percentage that expresses the market's implied chance of victory, and it provides a direct numeric baseline to compare with your model or an external benchmark Implied probability: definition and conversion from American odds.
Practically, convert the moneyline, then treat that probability as the market baseline. If your internal model gives a higher probability for a team, the difference is your raw edge before costs or vig. If the difference is small, document that result and classify it as a low confidence read; if larger, consider what news items or model assumptions explain the gap.
Determine the market favorite by checking consensus moneylines and spreads, converting the moneyline to implied probability, verifying the NBA injury report, comparing season efficiency metrics, and using a benchmark model for a sanity check. Document inputs and state a confidence category.
Before you finalize a pick, verify the current moneyline and any benchmark model probabilities to see if your edge still holds.
How to compare market-implied probabilities to public model outputs as a sanity check
Public models like the ESPN BPI provide matchup probabilities that serve as a useful external reference point, and analysis pieces such as SI's matchup overview. Comparing the market-implied probability to a benchmark model can reveal whether the market and public models broadly agree or whether a notable divergence merits deeper investigation ESPN NBA BPI matchup overview.
A large divergence between the market and a benchmark model can mean several things: news that the market has already priced in, an input your model is missing, or a potential inefficiency. You should not assume the market is wrong by default; instead, trace which inputs produce the gap and document your rationale for siding with either the market or your model.
How injuries and lineup changes should adjust your pregame pick
Quantifying roster changes in a simple model
Missing starters or key role players change minutes distribution and on-court production in ways that are straightforward to model in a basic adjustment. For small models, replace the missing player's per-minute contributions with likely replacements and recalculate offensive and defensive ratings roughly, then observe how the net-rating gap shifts. For any substantive change, annotate which minutes and matchups are affected rather than issuing a blanket statement about overall team quality NBA team advanced stats.
In practice, missing a primary ballhandler or a key defensive wing usually has a larger effect than a deep bench scorer. Make conservative adjustments when uncertain and prefer provisional picks if you do not have clear minutes projections before lock.
When to defer a final pick until injury report lock
Wait for injury report lock if a late decision about a starter is pending or if a probable designation still leaves material doubt about minutes. The official injury report is the authoritative source for availability and is the point at which most market movement stops reflecting line-shaping uncertainty and instead reflects settled expectations NBA official injury report.
If you must publish before lock, label the pick provisional, list assumptions, and provide the timestamp for the odds and the last checked injury report. That documentation allows readers to replicate your decision and supports the disciplined record-keeping used in FundedPlays-style challenges.
Decision framework: making the Bucks vs Bulls pick and stating confidence
Combining market probability, injury adjustments, and efficiency gap
A compact decision checklist brings the elements together: start with a consensus moneyline and convert to implied probability, adjust for confirmed injuries and minutes, compare the adjusted net-rating differential, and run a benchmark comparison with public models. Each step narrows the list of credible reasons to pick one side over the other NBA odds consensus board or see the specific matchup page on VegasInsider.
One frequent error is giving too much weight to historical head-to-head records. Historical logs provide context but typically have lower predictive power than current-season efficiency metrics and live availability, so they should not override up-to-date inputs in a pregame read Milwaukee Bucks vs Chicago Bulls head-to-head page.

Use history as background color for narratives, not as the primary driver for a probabilistic pick. Recent form within the current season and the most relevant efficiency metrics carry more predictive value for a single game.
Misreading public model vs market divergence
Another pitfall is assuming a public model is correct when the market diverges. A divergence can be informative, but it requires tracing which input differs. Often the market has absorbed late injury news or a change in rotations that a public model has not yet accounted for, so document what each side is using before choosing which to trust ESPN NBA BPI matchup overview.
Conversely, do not reflexively side with the market by default. If your model consistently explains why the market is off and your documentation supports that explanation, treat the difference as an actionable edge while continuing to monitor calibration over time.
Practical examples and a pregame checklist for the writer
Two short scenarios showing how inputs change the favorite
Scenario A, described qualitatively: assume the market opens with a clear favorite but that team loses a starting wing to a game-time out. In that case, expect minutes to shift to secondary defenders and for the moneyline to move toward a closer implied probability. Recompute net-rating impact by replacing the missing starter minutes with the likely backup minutes and adjust your pick accordingly NBA team advanced stats.
Scenario B, described qualitatively: imagine a team with a small market edge has the opponent's primary ballhandler listed questionable. If the official report confirms the ballhandler will sit the market will often swing strongly toward the other team and the implied probability gap widens. Document that swing with the time and source for the injury change and rerun your benchmark comparison to see if the edge clears your confidence threshold.
A compact pregame checklist to copy into a writeup
Paste into the top of your story
A ready-to-use pregame checklist to paste into a writeup
Use this checklist when preparing a pick: 1) record the consensus moneyline and spread with timestamp; 2) summarize the official NBA injury report findings with timestamp; 3) list both teams net rating and key efficiency notes; 4) note a public benchmark model read such as BPI; 5) state the final pick and confidence category; 6) add a short documentation note explaining any deviations from defaults. That compact record supports reproducibility and later evaluation NBA odds consensus board.
Avoid inserting hard claims about guaranteed outcomes. State inputs clearly and cite the sources used so readers can follow how you reached a conclusion.
Conclusion: a disciplined, transparent workflow to state who is favored
What to include in the final published pick
For documentation, record the snapshot odds, the injury report timestamp and summary, the season efficiencies you relied on, and the benchmark model comparison. This compact package is all a reader needs to understand why a side was labeled the market favorite or why you disagree with that label Implied probability: definition and conversion from American odds.
This makes your decision auditable and aligns with the FundedPlays emphasis on documented, reproducible forecasting rather than opaque assertions.
Use the standard American-odds conversion formula to turn the moneyline into an implied percentage. That percentage is the market-implied probability and serves as a baseline for comparison with your model.
Trust the NBA official daily injury report for final availability. It is the authoritative source and often causes the last meaningful market movements before tipoff.
Publish timestamped odds, the official injury report summary with timestamp, the season efficiency metrics used, a benchmark model reading, your final pick, and a clear confidence category.
References
- https://www.investopedia.com/terms/i/implied-probability.asp
- https://www.vegasinsider.com/nba/odds/
- https://official.nba.com/injury-report/
- https://www.nba.com/stats/teams/advanced/?Season=2025-26&SeasonType=Regular%20Season
- https://www.espn.com/nba/story/_/id/32476622
- https://www.basketball-reference.com/teams/CHI/head2head.html#MIL
- https://www.fundedplays.com/challenges
- https://www.fundedplays.com/blogs/how-fundedplays-evaluations-work
- https://www.fundedplays.com/blogs
- https://www.fundedplays.com
- https://sports.yahoo.com/articles/bucks-vs-bulls-prediction-picks-141600379.html
- https://www.si.com/betting/bulls-vs-bucks-prediction-odds-and-best-nba-prop-bets-for-tuesday-feb-3
- https://www.vegasinsider.com/nba/matchups/bucks-vs-bulls/