
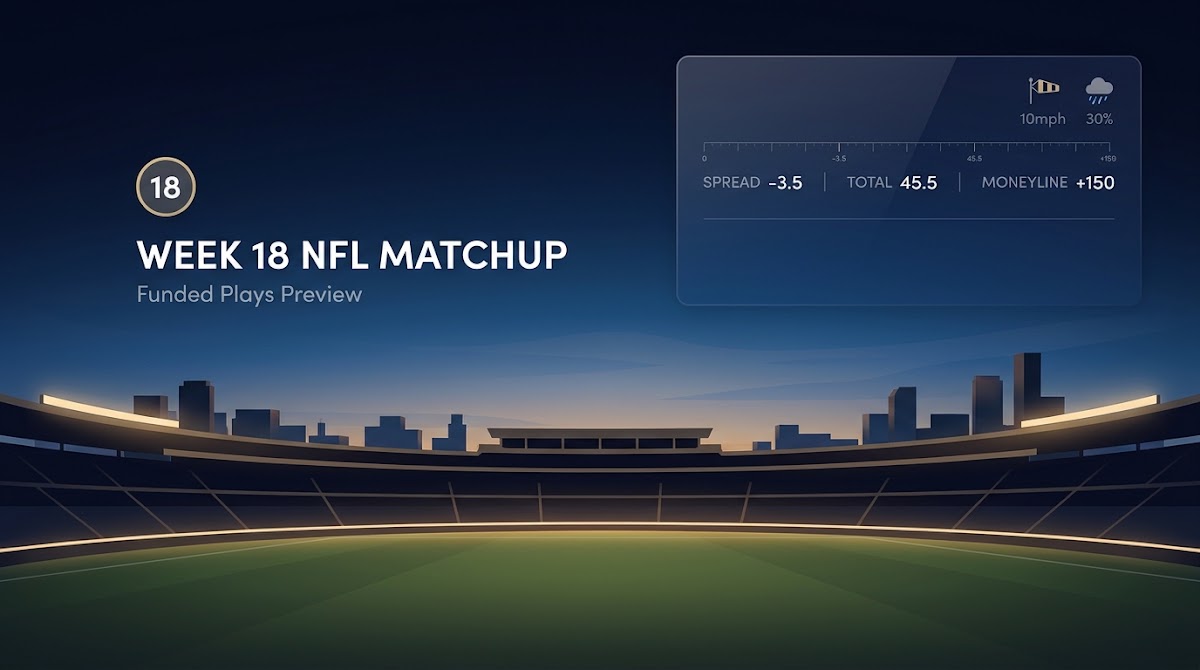
Quick snapshot: current broncos chargers prediction and market prices
Opening vs current prices
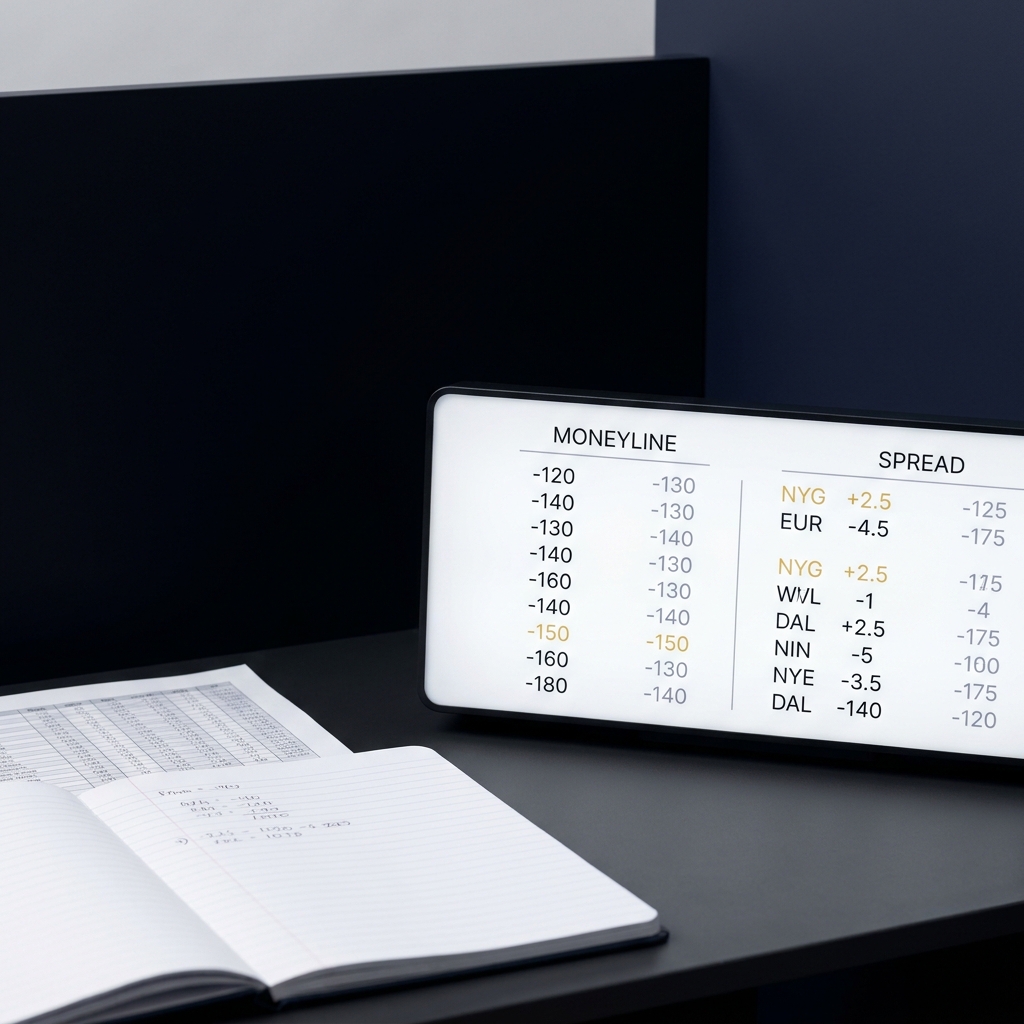
Start by logging the usual quotes: opening spread, current spread, opening and current moneylines, and total points. Recording both opening and live prices for sides, moneylines, and totals is the baseline for any broncos chargers prediction write-up because you will convert each American-odds quote into an implied win probability before comparing to your model What's the Chargers-Broncos Betting Line in Week 18?.
To keep conversions consistent, note whether prices are presented as American odds or as decimal/fractional equivalents and record the exact time you captured each number so you can later compare to the closing price.
Below is a short worked example showing how to convert a hypothetical moneyline into implied probability, using the standard formulas for American odds as described in technical resources; this step is essential to turn market prices into apples-to-apples probabilities before comparing to your model output Implied Probability: Definition, Formula, and Uses.
Example: if a hypothetical team is -150 on the moneyline, the implied probability for a negative American odd is calculated as 150 / (150 + 100) = 0.6, or 60 percent. If a team is +130, the implied probability is 100 / (130 + 100) = 0.4348, or about 43.5 percent. Use the same conversion for totals and alternative markets where American odds are given.
Explore structured prediction challenges on FundedPlays
Track your opening, the price you can get, and the official closing price so you can measure whether you beat the market over time.
How to convert American odds to implied probability
The formulas you need
There are two simple formulas: for positive American odds (underdog) use 100 / (odds + 100), and for negative American odds (favorite) use -odds / (-odds + 100). Applying these transforms standardizes different price formats into an implied probability you can compare to any model forecast, which is why conversion is a core first step in any broncos chargers prediction workflow Implied Probability: Definition, Formula, and Uses.
Quick checklist for conversions: confirm sign and magnitude, apply the correct formula, express the result as a percentage, and keep the raw odds alongside the percentage in your log so you can audit later.
Market-implied probabilities across both sides will typically sum to more than 100 percent because bookmakers include a margin. To compare a pure model forecast to market-implied probabilities, remove the implicit bookmaker margin by normalizing the pair of implied probabilities so they sum to 100 percent; that gives you a fair apples-to-apples market-implied forecast to compare with your model.
When margins are small, rounding can matter for edges of a few percentage points; avoid aggressive rounding in your spreadsheet and carry at least four decimal places during intermediate calculations, then round only for presentation.

Market movement and closing line value: why the closing price matters for Week 18
What closing line value indicates
Closing line value, or CLV, is the difference between the price you secure and the final market closing price; consistently beating the closing price is widely used as evidence that your selections have positive expected value over time Closing line value (CLV): why beating the closing price matters.
One-off instances of beating or missing the close are noisy; the meaningful signal is a pattern of CLV across many selections rather than a single-game result. Treat CLV as a performance metric for your process, not as a guarantee of outcomes.
Log opening and current lines, convert American odds to implied probabilities, normalize for vigorish, compare to your model, adjust for Mile High elevation and typical January climate, check public splits for context, then record whether your number beats the closing price to measure expected value over time.
How to track whether your number beat the market
Practically, log three prices for each selection: opening price, the price you took, and the official closing price. Over a season, calculate the average difference between the price you received and the close to quantify your CLV trend, and use that trend to judge whether your forecasting and execution are improving. See related posts on the Funded Plays blog.
When you pair CLV tracking with proper stake-sizing and record-keeping, you can progressively refine both model assumptions and market timing decisions instead of treating each Week 18 game as isolated fortune.
Interpreting public betting splits for Broncos Chargers
Tickets versus handle: what each shows
Public betting splits report how many tickets and how much money support each side; ticket splits show volume of individual bets while handle splits show the distribution of stake size, and the two can diverge if a small number of large bets are on one side. Use splits as context for where market attention is, but do not assume splits are predictive by themselves Betting splits explained: what they are and how to use them.
If you see a large ticket lean with a neutral handle split, that often signals many small bettors on one side, whereas a handle lean suggests larger stakes are backing that side and may carry different informational content.
When public splits matter and when they do not
Public splits become more informative when they coincide with other signals such as late sharp moves, injury news, or sudden line shifts; when they stand alone, they are descriptive of market sentiment but not a reliable causal predictor. Always combine splits with your model output and venue considerations before changing a position.
Use this quick mental checklist when evaluating a heavy public lean: is there corroborating info, is the market liquid enough for the lean to matter, and would acting against the public meaningfully reduce your expected value after accounting for vigorish and execution cost?
Venue and weather: how Empower Field at Mile High and January conditions affect the matchup
Elevation, cold weather and typical effects on totals and kicking
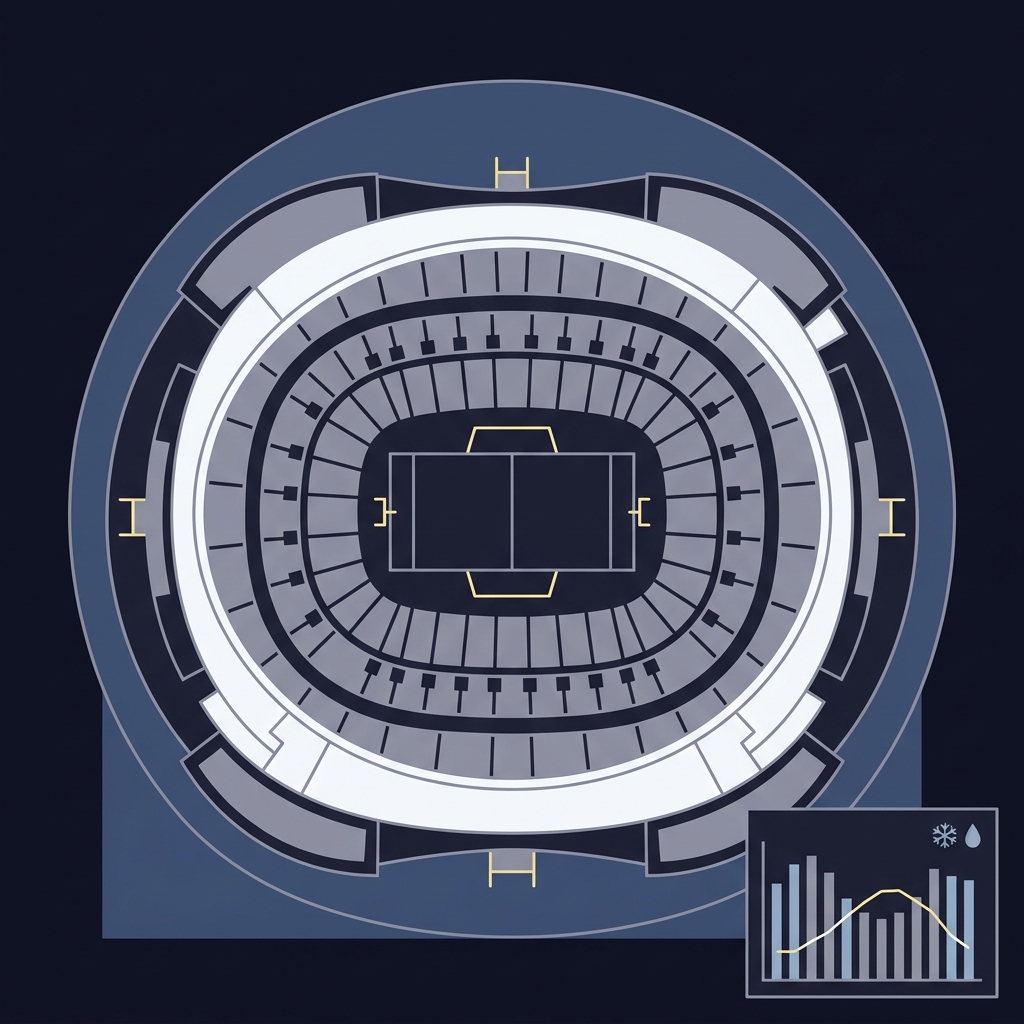
Empower Field at Mile High sits at about 5,280 feet elevation, and that altitude can reduce air density, generally favoring longer passes and affecting kicking distances and ball flight; account for this when judging totals and field-goal reliability in any broncos chargers prediction that involves Denver Stadium Info: Empower Field at Mile High.
Cold temperatures and potential winter winds in early January can counteract altitude effects by reducing scoring and making the kicking game less reliable, so treat elevation and expected temperature together when adjusting model priors for totals and special teams.
Using NOAA climate normals to set priors for early January games
NOAA's 1991-2020 climate normals give a stable baseline for typical January conditions in Denver; use those normals to set a priors range for temperature and wind rather than relying solely on single short-term forecasts when building pregame assumptions U.S. Climate Normals (1991-2020) - Product Overview.
Practically, if long-term normals suggest bitterly cold average temperatures, bias your expected total slightly lower and widen your uncertainty band for the kicking game; document how much you adjust so you can evaluate the effect after the game.

Market liquidity and the 2025 sports betting landscape: what tighter books mean for Week 18
How large regulated markets compress mispricing
The regulated U.S. sports betting market reached record scale by 2025, which generally increases liquidity for NFL sides and totals and compresses obvious mispricing; that makes finding large, persistent value harder and increases the importance of disciplined small-edge strategies State of the States 2025: The AGA Survey.
In deeper markets the variance of price discovery tends to fall, so a small model-market gap that persists and is backed by CLV can be economically meaningful even when the raw percentage edge is modest.
Why small edges matter more in liquid NFL markets
When books are tight, execution and consistent small advantages compound; the difference between breakeven and a long-term edge often lies in disciplined sizing, repeatable process, and CLV measurement rather than in large single-game deviations.
Adjust your expectations: in 2026 Week 18 games you should realistically hunt for fractional percentage edges supported by clean reasoning and documented CLV rather than expecting frequent large mispricings.
Adjust your expectations: in 2026 Week 18 games you should realistically hunt for fractional percentage edges supported by clean reasoning and documented CLV rather than expecting frequent large mispricings.
Model versus market: a disciplined checklist to spot a genuine edge on the Broncos Chargers game
Compare implied probability and model forecast
Step 1, convert the market price to an implied probability using the American-odds formulas; step 2, apply a vigorish adjustment to normalize the market's overround; step 3, compare the normalized market probability to your model forecast and record the percent gap Implied Probability: Definition, Formula, and Uses.
Check for CLV and venue-weather adjustments
Step 4, adjust the model or the market comparison for venue effects such as Mile High elevation and for NOAA-based January priors; step 5, check public splits for context and look for evidence of late sharp money that could explain moves; step 6, avoid action if the market is thin or if a late move lacks transparency Closing line value (CLV): why beating the closing price matters.
compute implied probabilities and closing line value quickly
copy into a simple spreadsheet
Typical errors and traps to avoid in Week 18 betting write-ups
Overreacting to last-minute rash moves
One common mistake is overfitting to late movement without understanding who moved the line; late sharp moves can matter, but panicking and changing a forecast on every last-minute swing usually increases noise in your record rather than improving it Betting splits explained: what they are and how to use them.
Corrective action: pause and check whether the move aligns with credible new information, whether liquidity explains the shift, and whether your model already accounted for the likely cause.
Misusing betting splits as causal evidence
Treat public splits as descriptive; they tell you who is betting but not why, and acting solely on splits without a model check can turn sentiment into a persistent disadvantage. Avoid assuming correlation equals causation when a heavy public lean appears on one side.
Quick fix: only let splits change your stance when they coincide with model disagreement plus plausible new information, and always log why you deviated.
Practical scenarios: worked examples of comparing model output to market odds
Scenario A - narrow spread
Illustrative numbers: suppose the market posts a spread that converts to a 52 percent implied probability after normalizing for vigorish and your model says 56 percent. The 4-point gap is modest; check liquidity and CLV potential before staking. If the market is deep and CLV tends to be minimal, it may be reasonable to size conservatively rather than treat the gap as decisive Implied Probability: Definition, Formula, and Uses.
Document this with opening price, your taken price, and the closing price so you can measure whether that 4-point perceived edge actually materializes as CLV over time.
Scenario B - late movement
Illustrative example: you get an interim price that implies a 48 percent chance but the line moves late to imply 53 percent NFL line movement for Week 18. If your model was steadfast at 50 percent, examine public splits and sharp-money indicators to determine whether to chase. A late move explained by injuries or reliable sharp action may be worth respecting, but an unexplained shift often warrants caution Closing line value (CLV): why beating the closing price matters.
Keep a short note in your log explaining why you chased or declined; these notes are the data that let you compute CLV and refine decision rules.
Scenario C - weather impact on totals
Illustrative approach: assume NOAA normals and stadium elevation suggest a slightly lower expected total in Denver in January; if the market total does not reflect those priors and your model lowers the expected points accordingly, you may find a modest edge on the under. Use documented NOAA normals as your baseline when explaining why you adjusted your forecast U.S. Climate Normals (1991-2020) - Product Overview. Use local odds as context Broncos vs. Chargers betting odds.
After the game, compare the final scoring and your logged adjustments to see whether that weather-informed deviation produced CLV and contributed positively to your record.
Bankroll and risk management for late-season games
Sizing considerations when markets are tight
When books are tight in deep markets, favor conservative stake sizes: small percentage-of-bank stakes protect against variance and allow you to act on modest model-market gaps without risking large drawdowns. Favor flat sizing or low Kelly fractions until you have demonstrated CLV across a meaningful sample Closing line value (CLV): why beating the closing price matters.
Document every stake and its rationale so you can later compare stake outcomes to CLV trends; consistent, small, repeatable advantages compound better than sporadic large bets based on conviction without track record.
How to treat a small percentage edge
Small edges deserve measured respect: they can be valuable if reproducible and paired with good execution. Avoid overleveraging single edges and use them to build a long-term record that you can evaluate for CLV rather than increasing size dramatically after a few wins.
Remember that no strategy guarantees success; treat bankroll rules as risk-control protocols rather than growth hacks.
Tracking postgame outcomes and verifying closing line value
Where to archive opening and closing prices
Keep a simple spreadsheet with fields for date, opponent, market (opening and closing), the price you took, stake size, and result; these fields let you calculate per-play CLV and aggregate the metric across weeks to see whether your methods are producing value Closing line value (CLV): why beating the closing price matters.
Include brief notes explaining why you deviated from your model on any play so you can later classify wins and losses by decision type.
How to interpret CLV results over a season
Aggregate CLV over a sufficient sample before judging your model; a handful of games is noisy. Look for persistent positive CLV and consistency in execution before increasing stakes or altering the core model.
If CLV is mixed, examine whether specific markets, times of day, or venue-weather conditions explain the variance and iterate your process accordingly.
What the 2025 market structure means for finding edges in 2026 Week 18 games
Implications of regulated-market growth
The expansion of regulated U.S. sports betting through 2025 has increased market liquidity, which generally tightens quoted lines and reduces large, obvious mispricings; that structural change raises the bar for finding reliable edges in 2026 Week 18 games State of the States 2025: The AGA Survey.
Practically, this means disciplined math, careful CLV tracking, and venue-aware adjustments are more important than ever for small-scale predictive players who seek reproducible edges.
Practical takeaway for small-scale predictive players
Accept that edges will be smaller and act conservatively: prioritize repeatability, documentation, and CLV rather than chasing large, rare mispricings that may disappear as liquidity increases.
Look for niches where your model has an informational advantage and document the outcomes across multiple games to demonstrate whether the edge is real how Funded Plays evaluations work.
Final summary: concise broncos chargers prediction checklist and next steps
Three quick takeaways
1) Convert every quoted odd into an implied probability and normalize for vigorish; 2) track opening, bet, and closing prices to measure CLV; 3) adjust for Mile High elevation and NOAA January normals before committing to totals or place-kicking assumptions Implied Probability: Definition, Formula, and Uses. Learn more at Funded Plays.
Log each decision, keep stake sizes conservative while you build a CLV record, and treat public splits as context rather than a primary signal when forming a broncos chargers prediction.
Process over prediction: following the checklist consistently is the most reliable way to determine whether your approach yields value over a season.
Use the standard formulas: for negative odds use -odds / (-odds + 100), for positive odds use 100 / (odds + 100), then express as a percentage and normalize for bookmaker margin.
CLV measures whether your execution beats the final market price over time; consistent positive CLV is a commonly used signal that your process may have long-term expected value.
Not by themselves; use splits as context alongside model output, venue-weather adjustments, and liquidity checks before changing a position.
References
- https://www.investopedia.com/terms/i/implied-probability.asp
- https://www.pinnacle.com/en/betting-resources/educational/closing-line-value
- https://www.vsin.com/betting-education/betting-splits-explained/
- https://www.empowerfieldatmilehigh.com/stadium-info
- https://www.ncei.noaa.gov/products/us-climate-normals
- https://www.fundedplays.com/challenges
- https://www.americangaming.org/resources/state-of-the-states-2025/
- https://www.fundedplays.com
- https://www.fundedplays.com/blogs
- https://www.fundedplays.com/blogs/how-fundedplays-evaluations-work
- https://www.chargers.com/news/nfl-betting-odds-broncos-week-18-2025
- https://www.cbssports.com/nfl/news/nfl-line-movement-for-week-18-chargers-broncos-jets-bills-among-games-with-biggest-shifts/
- https://www.milehighreport.com/denver-broncos-odds/168251/broncos-vs-chargers-odds-week-18