

Quick answer and what this model-driven preview covers
Short verdict based on methodology, blue jays orioles prediction
Short verdict: using a run-expectancy and base/out state framework, a credible pregame estimate will produce a single probabilistic view of how likely the Blue Jays are to win while highlighting the uncertainty bands around that estimate. For this preview I use the RE24 and win-probability concepts as the backbone of the calculation to keep the method transparent and reproducible, rather than offering a single declarative pick for fans to follow FanGraphs win probability library
A credible pregame probability uses RE/WP as the core method, applies Statcast park adjustments for Camden Yards, and updates for confirmed starters, lineups, and weather; the final chance depends on those inputs and model calibration.
This model-driven preview does not promise outcomes. It shows how park adjustments, confirmed starters, lineups, and weather move a baseline fractionally, and why those inputs must be refreshed close to game time for an accurate blue jays orioles prediction. The numbers the model returns are only as reliable as the inputs and the calibration used to convert run expectancy into a game win probability.
How baseball win-probability models work (RE24 and base-out states)
Run expectancy (RE24) basics
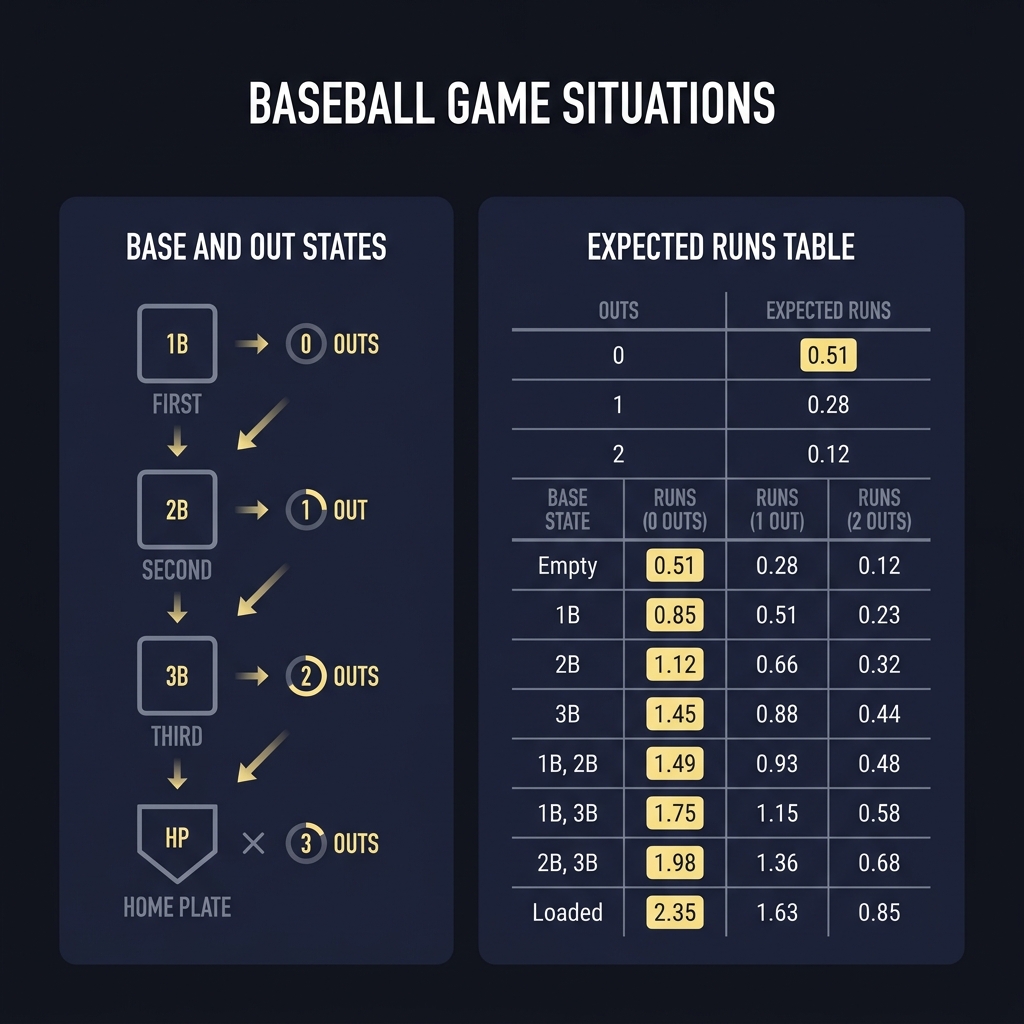
At the core of many modern game-probability systems is run expectancy, commonly summarized as RE24, which maps every base and out state to an expected number of runs scored over the remainder of the half inning. RE24 is a practical way to translate the game state into expected runs without complex play-by-play simulation, and it is described in detail in accessible resources on run expectancy FanGraphs run expectancy guide

Win probability updates after every plate appearance because the base/out state changes the expected future scoring. A single that shifts runners into scoring position has both immediate run value and a systemic effect on the inning's remaining run expectancy, and models that track the base/out transitions every plate appearance produce the same stepwise WP movements that fans see in live win-probability displays FanGraphs win probability library
Put simply, WP aggregates the current score, the expected runs remaining for each team given the base/out state and innings left, and the statistical distribution of future outcomes to generate a probability that one team will finish ahead. That aggregation is routine in pregame models too, where the expected runs per half-inning are summed forward from a neutral or adjusted baseline and then compared to the opponent's expected runs to form a pregame win probability.
Why park factors matter: Statcast baseline and Camden Yards specifics
How Statcast normalizes park effects to a 100 baseline
Statcast park factors are expressed relative to a 100 league-average baseline so modelers can directly scale expected events up or down when a game is played in a specific ballpark. Using those park-adjusted rates for the events that most affect run scoring helps a model reflect local scoring conditions instead of assuming neutral offense, and Statcast explains which events are lifted or suppressed by each park MLB Statcast park factors
To put the idea into practice, a neutral RE/WP baseline is multiplied by park-specific multipliers for overall run environment and for event-specific probabilities such as home runs and extra-base hits. Those adjustments are essential when a stadium consistently suppresses or boosts discrete offensive outcomes compared to the league baseline.
Camden Yards left-field wall and its effect on right-handed power
Camden Yards continues to present a unique left-field profile that suppresses some right-handed home runs and alters expected run output for teams that rely on opposite-field power, so a Blue Jays lineup with right-handed pull hitters will register a different expected scoring profile in Baltimore than in a neutral park MLB analysis of Camden Yards and the Statcast venue page.
Receive pregame model notes and park-factor refreshes
Sign up for timely model updates and park-factor refresh alerts to get pregame probability notes delivered before first pitch.
Because park factors can drift during a season as rosters and weather evolve, modelers should consult the most recent park-factor leaderboards and refresh the multipliers before finalizing a pregame probability Statcast park factors leaderboard
Converting market odds to implied probability and adjusting for the bookmaker margin
American odds to implied probability formula
Converting American odds to an implied probability is a necessary step when you compare your model's output to market prices. The standard conversions are straightforward and help you translate a posted line into an objective probability that can be compared to an RE/WP estimate, and the basic formulas and examples are documented in practical guides on implied probability Investopedia implied probability guide
For a concise worked example, convert an American favorite and an underdog to implied probabilities, then normalize if necessary to make the pair sum to more than 100 percent when the bookmaker margin is present. That normalized pair is what you compare to a model after removing the vig.
How to remove vig to compare to a model
Removing the bookmaker margin or vig can be done with a basic proportional adjustment where you divide each implied probability by the sum of implied probabilities for both sides, then rescale so the pair sums to 100 percent. This yields the market's estimate of true chances, absent the house edge, and makes it possible to compare a market-implied probability to your model's estimate on an apples-to-apples basis Investopedia implied probability guide
Remember that market-implied probabilities reflect both true assessments and money flow, so differences between your model and the market can persist for reasons unrelated to objective win likelihood.
Pregame model inputs that matter for Blue Jays vs Orioles
Starting pitcher quality and workload
Starting pitchers set the early run environment by influencing both the expected runs allowed per inning and the lineup exposure a team faces. Historical starter performance, handedness, recent workload, and matchup history should all be represented in the pregame input vector to affect the starting-point RE/WP baseline FanGraphs win probability library
Bullpen depth, lineup health, and recent form
Bullpen depth and leverage usage matter more in late-inning probabilities because high-leverage relievers change the distribution of late runs; current lineup health and recent offensive form shift expected runs the lineup will produce. Those inputs should be included and weighted so the model reflects both the starter's expected innings and the likely bullpen sequence MLB Statcast park factors

Open items to confirm within two hours of first pitch are the announced starters, the official batting orders, and any weather or wind alerts. Those last-minute items frequently change the pregame probability by moving the expected run environment or altering key matchups (Funded Plays).
How to weight inputs and validate the model: a backtesting approach
Choosing weights: historical calibration
Assigning weights to starters, bullpens, and park effects should be guided by historical calibration rather than intuition alone; backtesting across multiple seasons helps reveal which inputs move the probability most effectively and which adjustments are overfit to noisy data FanGraphs win probability library
Out-of-sample testing helps avoid overfitting. Reserve a holdout set of games to test predictive accuracy and inspect calibration plots rather than relying solely on in-sample fit statistics for weight selection FanGraphs run expectancy guide
Use a simple backtesting spreadsheet to track inputs and outcomes
One row per game for calibration
Out-of-sample testing and performance metrics
Appropriate performance metrics include Brier score for probabilistic accuracy and calibration plots to show whether predicted probabilities match observed frequencies; tracking these over rolling windows gives a realistic sense of model stability without promising a fixed threshold for success FanGraphs run expectancy guide
Worked example: a pregame probability calculation for Blue Jays vs Orioles
Step 1: baseline RE/WP from neutral conditions
Begin with a neutral RE/WP baseline that reflects average league runs per inning and typical base/out transition expectations. That baseline is the starting point before you apply park multipliers and matchup effects, and it is what you adjust to reflect Camden Yards or a pitcher mismatch FanGraphs run expectancy guide
Step 2: apply park adjustments, starters, and lineup changes
Apply the Statcast park factor adjustments to the baseline so you scale expected runs higher or lower depending on the park's effect on events such as home runs and extra-base hits. For games in Baltimore, the Camden Yards left-field profile will reduce the expected right-handed homer output compared to a neutral park and that reduction should lower the tally for lineups that depend on opposite-field power MLB Statcast park factors
Next, shift the baseline further for the announced starting pitchers by adjusting the expected runs allowed per inning for each team based on the starter's recent performance and workload. If a starter is trending toward short outings, increase the bullpen exposure in the model and weight bullpen replacement-level runs accordingly.

Step 3: convert to implied market comparison
After the model outputs a pregame win probability, convert any public American odds you want to compare into implied probabilities and then remove the vig so you get the market's de-biased estimate. A simple proportional normalization based on the sum of implied probabilities produces a comparable market figure to evaluate whether your model has an edge Investopedia implied probability guide
Keep the assumptions documented. In the worked example above do not present a single numeric final probability without the current starters, official lineups, and a weather check; instead present the directional effects and the method to reach a firm number when those items are confirmed.
How the game updates: applying RE24 and plate-appearance updates in play
When and how WP moves after plate appearances
Win probability moves after each plate appearance because the base/out state and the distribution of expected runs change. A walk that loads the bases or a double that clears runners will update the remaining inning's run expectancy and the game-level probability in predictable ways if your model precomputes the base/out multipliers FanGraphs win probability library
Practical tracking approaches include maintaining a table of precomputed base/out state multipliers and updating the live scoreline with the new expected runs after each event. That approach produces near-instant local WP updates without requiring a full simulation after every plate appearance.
Practical tips for live updating and tracking leverage
Track bullpen leverage by logging reliever matchups and the high-leverage index moments, because deployment of a top reliever materially compresses or expands the trailing team’s chance to recover in late innings. Those deployment patterns should be reflected in your in-play WP updates rather than treated as static assumptions FanGraphs win probability library
Decision criteria: when a model edge is actionable
Thresholds and confidence bands
An actionable edge is a reproducible probability gap after you remove the bookmaker margin and account for model uncertainty. Use conservative confidence bands derived from backtesting to prevent reacting to noise, and prefer repeated calibration over single-game deviations when deciding whether to act on a discrepancy Investopedia implied probability guide
Practical constraints: liquidity and lineup risk
Practical constraints such as market liquidity and last-minute lineup changes affect whether an observed edge is usable. Even a model with a clear directional advantage may not be actionable if the market size is small or if a late lineup change introduces outsized uncertainty that your calibration does not cover FanGraphs win probability library
Common errors and pitfalls to avoid in Blue Jays vs Orioles predictions
Overweighting small samples and recency bias
A common mistake is overweighting short recent streaks or tiny samples rather than relying on longer-term calibrated inputs; backtesting and out-of-sample checks help reveal when recency is noise rather than signal FanGraphs win probability library
Ignoring park and weather effects
Another frequent error is ignoring park-specific features such as Camden Yards left-field influences or failing to check wind conditions that alter the run environment; those omissions systematically bias expected runs and therefore win probabilities MLB analysis of Camden Yards
Technical pitfalls include stale park-factor inputs and data feeds that fail to update the latest leaderboards, which can make a model look calibrated until a seasonal shift reveals the mismatch Statcast park factors leaderboard
Matchup-specific scenarios: how different starting pitchers, lineups, and wind change the picture
Scenario A: Orioles starter limits right-handed power
If the Orioles start a ground-ball, right-handed pitcher who suppresses opposite-field home runs, Camden Yards park effects amplify that suppression and reduce the Blue Jays expected runs from right-handed hitters. In that situation the model should lower the projected runs for Toronto and reflect an increased value in base hits and speed for scoring.
Scenario B: Blue Jays bullpen is taxed from previous games
If Toronto’s bullpen had heavy usage in recent days and a key late-inning reliever has limited availability, the pregame model should increase the expected bullpen runs allowed in later innings and reduce the Blue Jays late-game win probability accordingly. That adjustment is best grounded in recent leverage and rest metrics rather than headline performance alone.
Scenario C: wind favors or suppresses carry in Baltimore
Wind and weather can flip the local run environment quickly at Camden Yards. A strong breeze into left field will suppress carry on right-handed fly balls further, while a breeze out can partially negate the left-field wall suppression; always check the near-term wind forecast to know which directional adjustment to apply to the park multipliers MLB Statcast park factors
For each scenario, refresh the data items that matter most: the confirmed starter, any late lineup substitutions, reliever rest, and the weather prediction for the stadium. These items commonly produce the largest directional shifts from a neutral baseline.
Pre-game checklist and quick reference for a Blue Jays vs Orioles prediction
Data to pull within two hours of first pitch: announced starters, official batting orders, updated Statcast park factors, last 72-hour bullpen usage, and the short-term wind forecast. Recording these items in a single table makes it simple to re-run the final model and document assumptions FanGraphs win probability library See our blog.
Quick adjustments to document include any handedness swap in the lineup, a bullpen arm scratched or activated, and a strong wind projection that alters homer probabilities. Keep a brief note of the model vs market comparison so you can recalibrate after the game.
Recommend refreshing the Statcast park-factor leaderboard periodically, especially for Camden Yards updates, since seasonal park effects and stadium changes change the multipliers that matter most for this matchup Statcast park factors leaderboard (see wider stadium rankings at ESPN) how Funded Plays evaluations work
Summary, how to track your model, and next steps
Key takeaways
RE/WP methods combined with Statcast park factors form the backbone of a credible pregame estimate, and Camden Yards features must be explicitly modeled for a Blue Jays vs Orioles assessment to avoid predictable biases FanGraphs win probability library
Further reading and data refresh cadence
Refresh park-factor leaderboards and starter confirmations close to game time, track calibration with Brier scores or calibration plots, and treat single-game deviations as data points for ongoing model improvement rather than standalone signals Statcast park factors leaderboard
Refresh starters, official lineups, park-factor leaderboards, and weather within two hours of first pitch.
Park factors are important but they must be combined with pitcher quality, bullpen state, and lineup health for a reliable probability.
No, you must remove the vig, account for model uncertainty, and consider liquidity and last-minute lineup changes before acting.
References
- https://www.fangraphs.com/library/misc/win-probability/
- https://www.fangraphs.com/library/misc/re24/
- https://www.mlb.com/news/statcast-park-factors-2024
- https://www.mlb.com/news/camden-yards-left-field-wall-statcast-effects
- https://baseballsavant.mlb.com/leaderboard/park-factors
- https://www.investopedia.com/terms/i/implied-probability.asp
- https://www.fundedplays.com/challenges
- https://www.fundedplays.com
- https://www.fundedplays.com/blogs
- https://www.fundedplays.com/blogs/how-fundedplays-evaluations-work
- https://baseballsavant.mlb.com/leaderboard/statcast-park-factors
- https://baseballsavant.mlb.com/leaderboard/statcast-venue?venueId=2
- https://www.espn.com/fantasy/baseball/story/_/id/47896015/fantasy-baseball-new-2026-home-stadiums-royals-rays-stats-projections-stats