
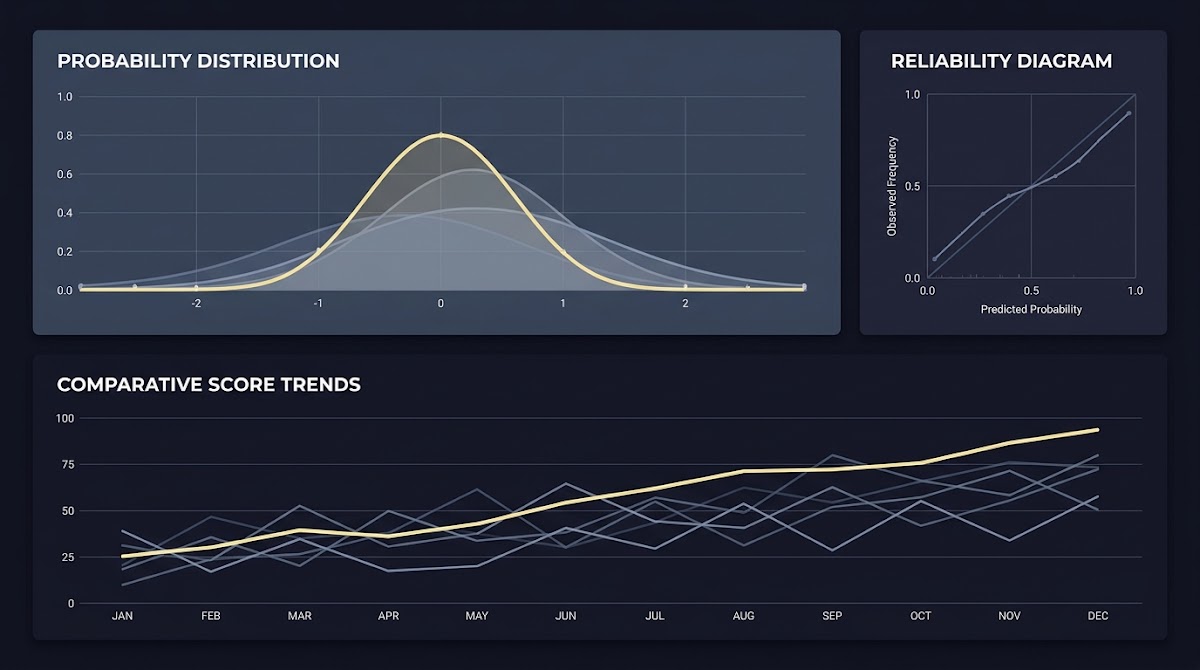
Quick overview: what we mean by accuracy for prediction apps
Why accuracy is probabilistic, not just correct or wrong
When analysts ask which is the most accurate prediction app they usually mean which app gives better probability forecasts for outcomes, not which one simply records more wins. In probabilistic terms accuracy is about how close predicted probabilities are to observed frequencies, so a forecast that says 70 percent and happens about 70 percent of the time is more useful than a forecast that records more isolated correct picks but provides misleading probability values. This distinction matters when you want consistent, repeatable decisions rather than a short-term hot streak.
To evaluate probability forecasts correctly you need scoring rules that reward honest probability statements and penalize overconfidence or underconfidence. Strictly proper scoring rules are the accepted standard because they incentivize truthful probability reporting; this principle is explained in foundational forecast evaluation research Journal of the American Statistical Association.
This guide lays out a defensible protocol to compare apps by using common out-of-sample event sets, post-hoc calibration where appropriate, proper scoring rules such as the Brier and log score, and paired significance testing to check if differences are real. It does not attempt to evaluate or rank specific commercial apps here, and it avoids short-term ROI as the primary quality metric because ROI is noisy and can mislead about underlying predictive skill.
Throughout the article you will find a stepwise audit workflow, practical calibration notes, and diagnostic checks that help turn raw app output into comparable probabilistic forecasts suitable for scoring and publication.
Hit rate counts how often the predicted event occurred when the app favored it, but it treats probability as binary and ignores the confidence behind predictions. Two apps can have the same hit rate while giving very different probability estimates, making one far more useful for decision making despite identical raw wins. Relying on hit rate can therefore reward overconfident predictions that win by chance and penalize well-calibrated forecasts that express appropriate uncertainty.

To move beyond hit rate you need metrics that consider both the probability assigned and the outcome. The Brier score is one such metric because it measures mean squared error between predicted probabilities and eventual outcomes, capturing both calibration and how concentrated probabilities are around extremes.
One advantage of the Brier score is that it decomposes into interpretable parts typically called reliability and refinement, which help diagnose whether errors come from miscalibration or from lack of discriminating power. Reliability reflects how well predicted probabilities match observed frequencies, while refinement reflects the forecaster's ability to separate events into groups with different outcome rates. This decomposition therefore identifies whether an app needs better probability scaling or better features to tell events apart; the concept dates back to classic verification work in forecast science Journal of Applied Meteorology. See discussion in On misconceptions about the Brier score.
In practical terms a calibrated forecast with moderate refinement can be more actionable than a high hit rate that conceals miscalibration. Calibration matters because decisions that depend on thresholds, risk budgeting, or portfolio allocation use the forecasted probabilities directly rather than simple right-or-wrong counts.
Strictly proper scoring rules to use: Brier, log score, and why they matter
Strictly proper scoring rules are mathematical functions that award the best expected score to someone who reports their true beliefs. In plain language this means an evaluator who wants honest probability statements should score forecasts using a strictly proper rule, because that rule discourages strategic misreporting and rewards good probabilistic judgment; this principle is explained in the statistical literature on scoring rules Journal of the American Statistical Association.
Compare apps on the same out-of-sample events using strictly proper scoring rules, apply post-hoc calibration on a held-out set, and use paired statistical tests to determine if score differences are significant.
A scoring rule is strictly proper when the unique expected optimum is achieved by stating true subjective probabilities. That property ensures that forecasters cannot improve their expected score by hedging probabilities away from their honest estimate. For applied audits, strictly proper rules therefore align incentives for app designers and make cross-app comparisons fairer.
Both the Brier score and the logarithmic score are strictly proper, but they emphasize different aspects of performance. Brier score is a quadratic penalty on probability errors and works well for everyday diagnostics, including decompositions into reliability and refinement. The log score is more sensitive to extreme probability assignments and therefore penalizes confident but wrong forecasts more heavily, which makes it useful when extreme probabilities matter for downstream decisions. Using both offers a fuller picture, and it is common to report multiple proper scores rather than rely on a single number Journal of the American Statistical Association.
Report both scores and inspect diagnostic plots to see whether differences are driven by extreme mispredictions or systematic calibration gaps. This combined view helps determine whether an app is genuinely better at expressing useful uncertainty or merely luckier over a sample.
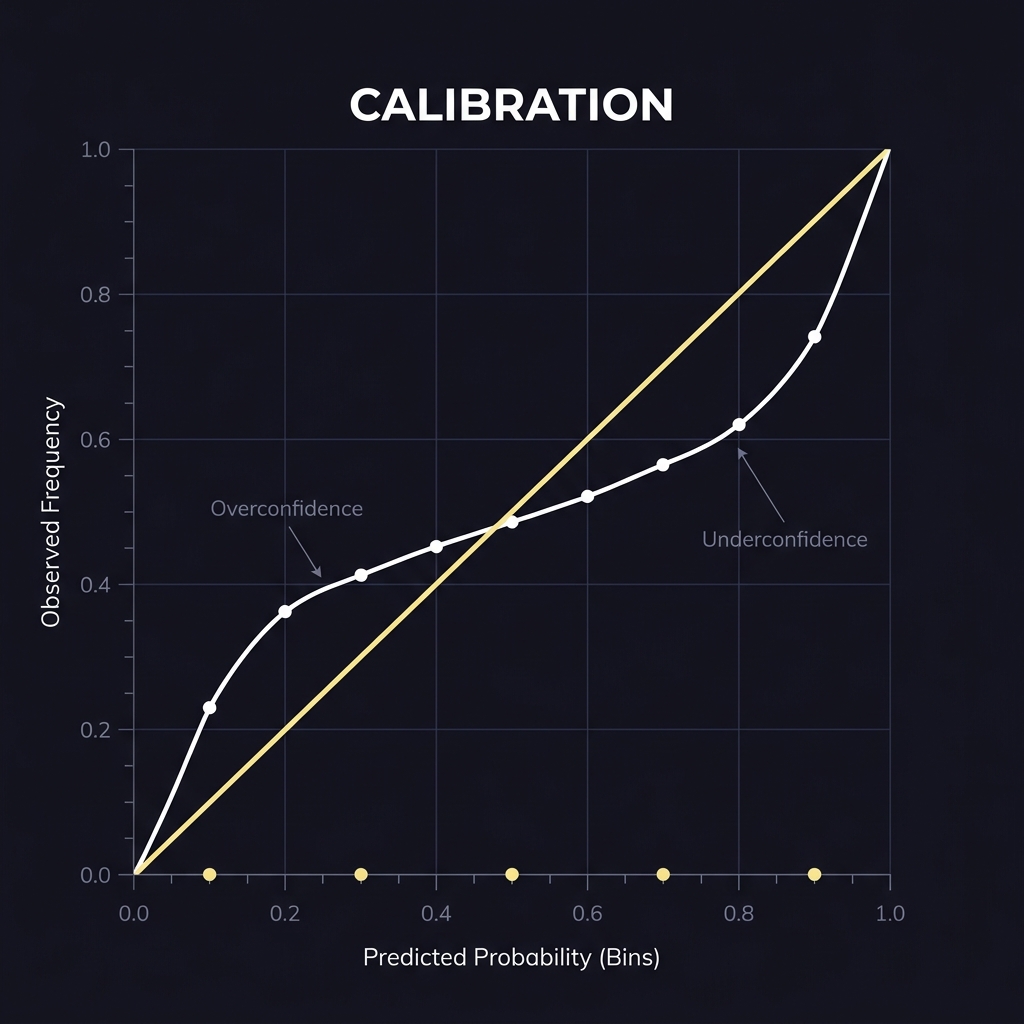
Modern machine-learning models, including neural networks trained for prediction tasks, frequently output probabilities that are miscalibrated; that is, predicted probabilities do not match observed frequencies consistently. Calibration failures can take the form of overconfidence at high predicted probabilities or underconfidence across ranges, and they are common even when classification accuracy is high. Addressing miscalibration before scoring avoids misleading conclusions about an app's real probabilistic skill ICML proceedings on calibration. See also recent analysis.
Because calibration affects the measured score directly, audits should not compare raw model outputs without considering post-hoc adjustments that align probabilities with observed frequencies on a held-out calibration set.
Post-hoc calibration means fitting a lightweight mapping from raw model outputs to calibrated probabilities using data reserved for that purpose. Temperature scaling is a commonly recommended method for modern classifiers; it rescales logits via a single temperature parameter fitted on a validation set and tends to preserve ranking while improving probability reliability. Other methods include isotonic regression and Platt scaling, each with tradeoffs in flexibility and overfitting risk. The practical rule is to calibrate only on data not used for the final evaluation and to keep the calibration model simple to avoid absorbing signal that should instead be part of the forecast model.
Checklist for calibration steps: hold out a validation set for calibration, choose a simple calibration model such as temperature scaling, fit and evaluate calibration on that set, then apply the mapping to the test set forecasts before computing final scores. This ensures the evaluation reflects calibrated probabilities rather than artifacts of model training.
How to design a fair app comparison: datasets, out-of-sample testing, and significance
Choosing a common out-of-sample event set
Fair comparisons require scoring every app on the exact same out-of-sample events with aligned market definitions. That means collecting timestamped probability forecasts, documenting the market or line being forecast, and ensuring that all apps are evaluated on events that were available to them at the forecast time. Without the same event set you risk selection bias where one app appears better because it reported on easier events or a favorable time window. This level playing field principle is a core requirement in predictive accuracy research Journal of Business & Economic Statistics.

When assembling an event set, document exclusion rules such as late data arrivals, correlated event clusters, and changes in market definitions. Keep a clear provenance record so that published comparisons can be audited and reproduced by others. See Funded Plays evaluations at https://www.fundedplays.com/blogs/how-fundedplays-evaluations-work.
Statistical tests to judge whether differences matter
Observed score differences can be sampling noise, especially with volatile sports outcomes. Paired significance tests such as the Diebold-Mariano test are designed to compare forecasting methods on the same events and to assess whether the mean score difference is unlikely under sampling variability. Using paired tests avoids treating random fluctuations as meaningful and helps determine whether a reported lead in score is robust rather than ephemeral.
Consider sample size and event heterogeneity: larger samples and diverse event types reduce variance and increase confidence in detected differences. If sample size is limited, report uncertainty measures such as confidence intervals or bootstrap distributions of score differences to communicate how reliable the ranking is.
A practical audit workflow: step-by-step checklist to compare bet slip apps
Start by collecting timestamped forecasts and matching outcomes. Standardize fields so that each record contains event ID, source app, forecast timestamp, market definition, predicted probability, and eventual outcome. Having a uniform schema makes calibration and scoring reproducible and reduces errors when aggregating results across apps.
Next split your pooled dataset into three non overlapping parts: a training or development set if you plan to build local models, a calibration set used only for fitting post-hoc mappings, and a held-out test set for final scoring. Calibrate each app on the same calibration set and compute strictly proper scores on the shared test set. This order preserves the independence of the test set and avoids optimistic bias.
Get the scoring checklist and template
Try a concise scoring checklist to log forecasts, apply simple calibration, and compute Brier and log scores in a reproducible script or spreadsheet.
Order of operations summary: 1) collect and align forecasts, 2) partition data into calibration and test sets, 3) fit post-hoc calibration on the calibration set, 4) apply calibration to test forecasts, 5) compute multiple proper scores, and 6) run paired significance tests on score differences. Present results with diagnostic plots such as reliability diagrams and cumulative score difference charts to make conclusions transparent. More detail at the Funded Plays blog: https://www.fundedplays.com/blogs.
Collecting and standardizing forecasts
Practical data collection involves storing raw forecasts with timestamps and preserving the market label. Avoid discarding late or corrected forecasts without a rule; either include them with a note or exclude them consistently across apps. Keep an exclusions log that explains missing data and the rationale so readers can evaluate whether exclusions bias the comparison.
Applying calibration, scoring, and statistical testing
Apply the same calibration method to every app using the shared calibration set, then compute Brier and log scores on the held-out test set. Report the full distribution of scores across events, the Brier decomposition to show reliability and refinement components, and paired test results to indicate significance. Visual diagnostics such as reliability diagrams and cumulative score difference plots help readers see whether one app consistently outperforms another or whether leads are concentrated in specific event types.
Common mistakes, pitfalls, and how to avoid them
Mistakes in dataset construction and selection bias
Evaluations that mix in-sample or overlapping data inflate perceived accuracy because models can indirectly learn from the outcomes they are later evaluated on. Prevent this by enforcing strict time splits and ensuring that calibration and test sets contain events unseen during model development.
Another mistake is allowing different exclusion rules across apps. If one app is allowed to omit late-release events while another is not, the comparison becomes invalid. Use consistent, documented exclusion criteria and report how many events were removed and why.
Misinterpreting ROI, overfitting, and cherry picking
Short-term ROI is a noisy indicator and can be dominated by variance rather than true forecasting skill, so avoid using it as the primary measure of predictive quality. Instead present ROI as a secondary, contextual metric and emphasize proper scoring results as the substantive evidence of probabilistic accuracy.
Cherry picking time windows or market subsets that favor one app undermines credibility. Predefine your test set and stick to it, or use out-of-sample rolling windows that reflect realistic deployment conditions to reduce overfitting to a chosen slice of history.
A defensible ranking of the most accurate prediction app follows reproducible steps: score all apps on the same out-of-sample event set, apply post-hoc calibration using a held-out calibration set, compute multiple strictly proper scores such as Brier and log score, and use paired significance tests to judge whether observed differences are robust. Publish the test data, calibration details, and scoring code where possible to allow independent verification. For an example visit Funded Plays at https://www.fundedplays.com.
Short-term ROI or hit rate can be included as descriptive context but should not be used alone to declare a winner. Instead focus on calibrated probability performance and clear uncertainty statements about what the data support; this approach produces rankings that are informative and defensible rather than sensational.
A Brier score measures the mean squared error between predicted probabilities and outcomes; lower values indicate better probabilistic accuracy and decompositions show calibration versus discrimination.
ROI can be informative for practical returns but is highly volatile and should not replace proper scoring and calibration when judging probabilistic accuracy.
Temperature scaling is a lightweight post-hoc method that rescales model logits using a single parameter fitted on a held-out validation set to improve probability reliability.
References
- https://www.tandfonline.com/doi/abs/10.1198/016214506000001437
- https://www.tandfonline.com/doi/abs/10.1080/01621459.1969.10501052
- https://journals.ametsoc.org/view/journals/apme/12/4/1520-0450_1973_012_0595_anvpot_2_0_co_2.xml
- https://proceedings.mlr.press/v70/guo17a.html
- https://www.tandfonline.com/doi/abs/10.1080/07350015.1995.10524599
- https://www.fundedplays.com/challenges
- https://www.activeloop.ai/resources/glossary/brier-score/
- https://pmc.ncbi.nlm.nih.gov/articles/PMC12818272/
- https://arxiv.org/html/2504.04906v3
- https://www.fundedplays.com/blogs/how-fundedplays-evaluations-work
- https://www.fundedplays.com/blogs
- https://www.fundedplays.com