

Quick take: best chances to win march madness
The most defensible short answer is simple: teams that appear both as market favorites in aggregated futures and near the top of opponent-adjusted predictive models form the most compelling contenders for the title. Market-implied odds give a live consensus, while ratings like BPI and KenPom estimate underlying team strength; using them together creates a reliable starting list for the best chances to win march madness, especially when those teams also show elite NET résumés TeamRankings futures page.
Teams with the best combined profile across market-implied futures, opponent-adjusted model ratings and strong NET résumés are the most probable champions; use an ensemble that averages normalized market and model probabilities with a résumé adjustment to rank contenders.
What this article will deliver: a clear headline answer, a plain explanation of why the NET and seeding matter, a practical guide to convert futures into implied probabilities, an overview of BPI and KenPom, a concrete ensemble recipe to blend signals, common mistakes to avoid, and three scenario-driven examples you can apply before bracket lock.
How the NCAA selection process and NET shape the best chances to win march madness
The NCAA selection committee explicitly uses the NET, strength of schedule and quadrant wins as central résumé criteria when building the field and seeding teams; teams that score strongly on those measures tend to earn higher seeds and more favorable matchups, which raises their pre-tournament title probabilities NCAA selection guidance.
Think of a team résumé as a season report card: NET summarizes overall performance and quality of wins, strength of schedule measures the difficulty of opponents, and quadrant results capture how many top-level wins the team earned. Those résumé elements shape seeding, and seeding in turn influences the path a team must navigate to reach late rounds, so résumé strength translates into measurable tournament advantage.
Why that matters for forecasting: higher seeds historically have placed teams into more favorable brackets and reduced the number of elite opponents they meet early, so histories of champion seeds show an advantage for top-seeded teams that models and markets routinely account for NCAA historical seed results.

Quick checklist of public data to consult for tournament forecasting
Use these sources to cross-check résumé and model signals
Practical implication: when a team combines a top NET profile with elite efficiency metrics, it generally occupies both the committee's favorable view and the models' top ranks, which increases the team's baseline probability of winning the tournament.
Market-implied baseline: converting futures into implied title probabilities
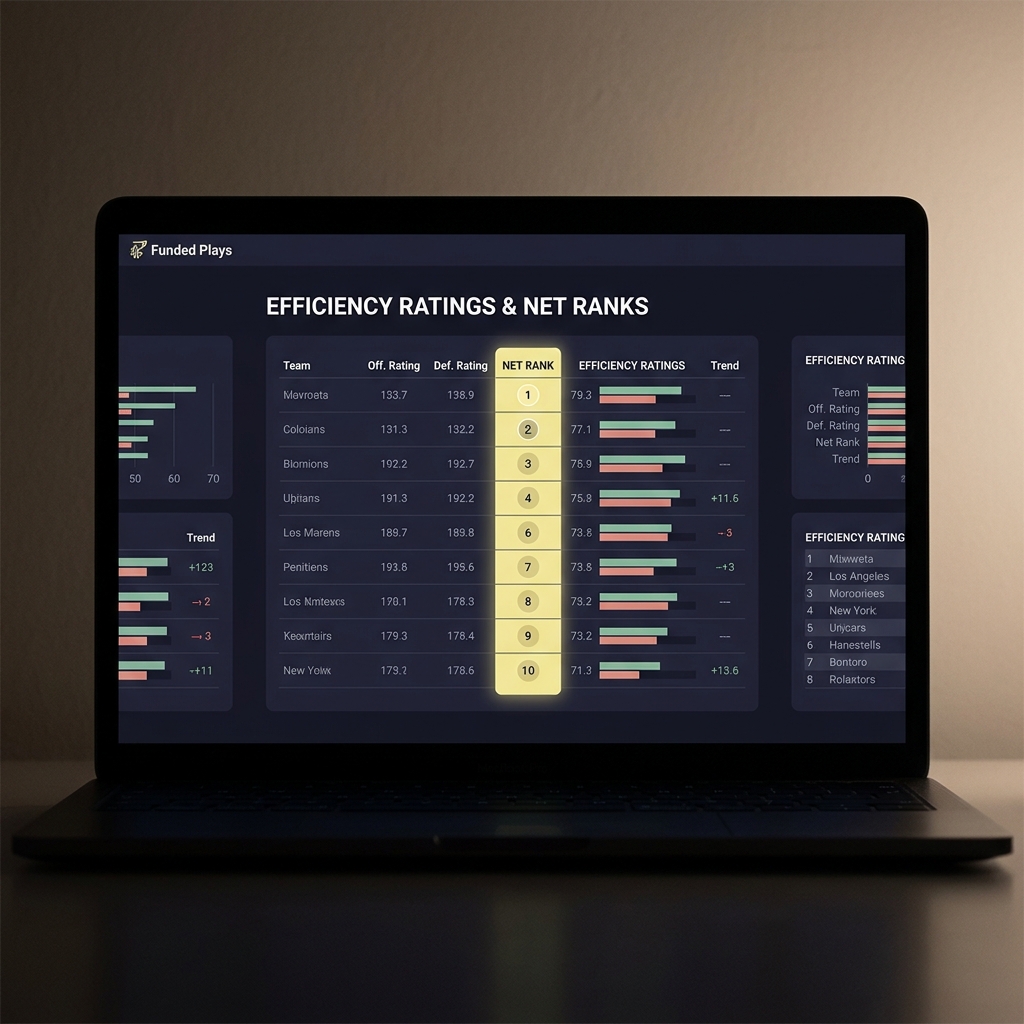
Aggregated futures across reputable sources provide the clearest real-time baseline for who the market thinks has the best chances to win march madness; converting listed odds into implied probabilities creates a current ranking you can weight against model outputs and other aggregators like ESPN's futures page and the TeamRankings futures page.
Step 1, read and normalize odds: collect futures prices from multiple aggregators, convert each team's odds to implied probability by using the standard 1/odds formula for decimal or an equivalent conversion for American odds, then normalize the probabilities to remove overround so the sum equals 100 percent. That normalized distribution becomes your market baseline. For example resources, consult aggregators such as Rotowire's futures list.
Step 2, what markets capture well and what they miss: markets quickly price in late news, public sentiment and injury reports, and they reflect where money is moving on teams; this responsiveness is valuable but may overreact to short-term noise or public bias. Market probabilities are especially useful for signaling which teams the broader betting public and sharps currently favor VegasInsider futures page and sportsbooks like DraftKings.
Step 3, caveats and technical checks: when aggregating, adjust for overround and for book-specific biases, and avoid treating short-lived price swings as permanent. Markets are a live consensus, not a certainty; use them as a dynamic baseline to compare with model-derived probabilities rather than a stand-alone verdict.
Get an ensemble worksheet and alerts for tournament forecasting
If you want an ensemble worksheet or threshold alerts that blend futures and model signals, sign up for challenge-style alerts and templated worksheets to track implied probabilities and model ranks before bracket lock.
Model-driven view: BPI, KenPom and what efficiency ratings tell us
Two model families matter most for title forecasting: BPI, which is designed to estimate team strength and win probabilities in context, and KenPom, which uses adjusted offensive and defensive efficiency and tempo to quantify opponent-adjusted performance; both systems seek to measure true team quality beyond raw wins and losses ESPN BPI explanation.

BPI produces a power index that attempts to translate opponent-adjusted performance into expected outcomes, which is useful for projecting how teams should perform against a typical tournament slate. KenPom separates offense and defense into adjusted efficiency ratings that control for opponent strength and tempo, giving a complementary view of where a team excels or struggles KenPom ratings explained. (see the Funded Plays homepage)
Why champions tend to be high-ranked in these systems: tournament winners almost always rate near the top on opponent-adjusted metrics entering the tournament because those measures capture consistent, repeatable performance rather than variance-driven hot streaks. That is why model outputs are a core input when deciding which teams have the best chances to win march madness.
An ensemble approach: combining markets, models and NET into a ranked forecast
A practical ensemble recipe balances three signals: normalized market-implied probabilities, normalized model probabilities (from BPI and KenPom), and a résumé score derived from NET, strength of schedule and quadrant wins. Normalizing each input puts them on the same scale so averaging produces a defensible combined probability TeamRankings futures page.

Concrete weighting rules to start with: use a 40/40/20 split where markets and models each get 40 percent and the NET-based résumé score gets 20 percent. That weighting acknowledges markets' information flow and models' structural strength while letting résumé signals adjust for seeding and matchup context.
When to reweight: increase model weight if a team shows persistent opponent-adjusted superiority that markets have not priced, and increase market weight after verified injury news or clear public-sharps divergence. Use the NET/resumé weight to adjust for likely seeding effects near selection and bracket release, especially when seeding differences change a team’s projected path.
Operational rules: normalize implied odds and model probabilities so they sum to one, compute a weighted average for each team, then rescale the ensemble back into probabilities. Track changes daily and set thresholds for when an ensemble probability moves enough to warrant an update to your bracket decisions or alerts.
Common mistakes and pitfalls when judging the best chances to win march madness
Relying on a single data source is the most common error. Public betting markets and one-off models each have blind spots: markets can overreact to short-term sentiment and models can miss late availability or matchup quirks. Combining signals reduces the risk of following a single misleading input VegasInsider futures page.
Misreading seeding and résumé importance is another frequent pitfall. Underestimating how NET, quadrant wins and strength of schedule influence seeding can cause you to ignore a team's likely bracket path and matchups, which materially affects title probability NCAA selection guidance.
Quick checks to avoid these mistakes: verify your sample size for model inputs, account for overround when aggregating futures, and maintain an injuries and availability checklist for late-season news. These habits limit overconfidence and keep forecasts responsive to the right signals.
Practical scenarios: three example contender profiles and how to rank them
Profile A: Market favorite with top model support
Scenario: a team leads futures after consistent public backing and also ranks near the top in BPI and KenPom. Interpretation: when markets and models align, the ensemble probability becomes high because two diverse information sets agree. In that case, give the market and model each full weight under the 40/40/20 recipe and use the NET score to check for any seeding or matchup caveats ESPN BPI explanation. See how we evaluate teams at how we evaluate.
Decision rule: favor the team in bracket construction and consider them a leading candidate, but still monitor injury and matchup reports because tournament dynamics can shift quickly.
Profile B: Model-rated team undervalued in futures
Scenario: a team ranks highly in opponent-adjusted metrics but futures show lower implied probability, perhaps due to public underreaction or a recent tough loss. Interpretation: models may be capturing true underlying strength that markets have not priced yet. Increase model weight modestly if the team’s efficiency metrics are stable and the résumé does not indicate seeding risk KenPom ratings explained.
Decision rule: treat this as a potential value candidate. Consider whether the market gap reflects real concern (injury, suspension) or is simply a pricing opportunity; if no disqualifying news exists, the ensemble should move the team higher than raw futures suggest.
Profile C: Strong résumé but late injuries or matchup risks
Scenario: a résumé-rich team with top NET and quadrant wins faces late injuries or matchup vulnerabilities that markets have partially priced. Interpretation: résumé strength earns seeding and a favorable path, but injuries and specific matchup issues can erode the team’s practical probability of winning. In such cases, increase the market weight to reflect verified availability concerns and let the NET/resumé weight signal potential seeding benefits NCAA selection guidance.
Decision rule: if injuries materially reduce projected efficiency, downgrade the ensemble probability and re-evaluate bracket placement; if injuries are short-term and expected to resolve, keep the team’s model weight higher but monitor updates closely.
Bottom line: how to use these methods responsibly when assessing who is predicted to win the NCAA tournament
Key takeaways: blend normalized market-implied probabilities with model-based probabilities from BPI and KenPom, and include a NET-based résumé adjustment for seeding and matchup context. Favor teams that score well across all three inputs, as those are the teams with the best chances to win march madness NCAA historical seed results.
Responsible next steps: build an ensemble worksheet, set clear reweighting triggers for injuries or sustained market-model divergence, and treat forecasts as probabilistic guidance rather than guarantees. Use the checklist at bracket lock time to confirm your top contenders and to document what would change your view. (see our blog)
Short pre-tournament checklist: confirm NET and quadrant counts, recheck normalized futures for overround, verify injury and availability reports, and compare model ranks to market ranks before making final bracket decisions.
Start by normalizing market-implied probabilities and model probabilities, then average them with a small résumé adjustment for NET and seeding; update weights for verified injuries or persistent model-market divergence.
NET helps determine seeding and résumé strength, which influence a team’s path and probability, but NET alone does not guarantee outcomes; combine NET with efficiency models and market signals.
No. Futures are a useful live consensus but can reflect short-term noise or public bias; combine them with opponent-adjusted models and résumé checks for a more defensible forecast.
References
- https://www.teamrankings.com/ncb/futures/ncaa-tournament-champion
- https://www.ncaa.com/news/basketball-men/march-madness/article/2024-03-10/how-the-field-of-68-is-picked-for-march-madness
- https://www.ncaa.com/news/basketball-men/march-madness/article/2024-03-12/how-often-do-no-1-seeds-win-march-madness
- https://www.vegasinsider.com/college-basketball/odds/futures/
- https://www.espn.com/mens-college-basketball/story/_/id/27540788/what-bpi-basketball-power-index-how-calculated
- https://kenpom.com/blog/ratings-explained/
- https://www.fundedplays.com/challenges
- https://www.espn.com/mens-college-basketball/futures
- https://www.rotowire.com/betting/college-basketball/futures.php
- https://sportsbook.draftkings.com/leagues/basketball/ncaab
- https://www.fundedplays.com
- https://www.fundedplays.com/blogs
- https://www.fundedplays.com/blogs/how-fundedplays-evaluations-work