

Base Rates and Their Role in Sports Forecasting: Definition and context
In practical sports forecasting, base rates are the long-run frequencies that serve as prior probabilities for future outcomes. Treating base rates as priors clarifies why they matter: a prior probability captures what is known from historical data before new game information is observed, and it combines with the likelihood of current signals to produce a posterior probability for an outcome according to Bayesian principles, as discussed in foundational texts on Bayesian inference and Bayesian Data Analysis
Using base rates anchors probabilistic forecasts so that unusual short-term streaks do not produce implausible probability estimates. When forecasters ignore base rates they risk overconfident predictions that do not reflect historical frequency, which reduces long-term calibration; this perspective follows from formal discussions of priors and their role in posterior inference Bayes' Theorem
Try a Structured Forecasting Challenge
Continue reading for a stepwise workflow that turns league-level base rates into deployable, calibrated forecasts without overstating outcomes.
Typical sources of base rates in sports include league-level win frequencies, long-run team averages, and aggregated market-implied rates when properly adjusted. These sources each have trade-offs: league aggregates are stable but coarse, team averages reflect identity but need shrinkage, and market-implied rates require careful adjustment for vig and time-varying sentiment Bayesian Data Analysis
How to estimate base rates from historical data
Choosing the right historical window to compute base rates is a balance between stability and relevance. Multi-season aggregation smooths random variation and produces more reliable long-run frequencies, but older seasons may reflect structural differences that reduce relevance; careful window selection avoids mixing incompatible eras Bayesian Data Analysis
When data are limited, small-sample noise can dominate naive frequency estimates; partial pooling through hierarchical models shrinks extreme team or player estimates toward the league mean, stabilizing forecasts and reducing overfitting as shown in applied hierarchical approaches to sports outcomes Bayesian hierarchical model for the prediction of football results
Practical cautions include excluding seasons with major rule changes, accounting for franchise moves or mergers, and flagging outlier years that reflect atypical competition structure. Documenting these exclusions preserves the defensibility of computed base rates and supports transparent model decisions Bayesian Data Analysis

Combining base rates with current information: Bayesian updating and dynamic rating systems
Sequential Bayesian updating is the operational mechanism by which priors become posteriors as new game results arrive. Each update blends the prior base-rate information with the likelihood from observed outcomes or new signals to produce a posterior that becomes the next prior, a pattern that supports coherent learning over time and follows standard Bayesian formulations Bayes' Theorem
Dynamic rating systems implement these sequential updates algorithmically, adjusting team or player strength estimates after every match. Modern approaches such as the documented improvements in skill rating systems illustrate how an initial prior can be tuned and updated to reflect evolving competitive balance TrueSkill 2
Quick implementation checklist for sequential Bayesian updates
Use conservative shrinkage to avoid overreaction
Balancing prior stability and rapid adaptation is a central practical choice. A very tight prior preserves calibration but can lag when a team genuinely changes, while a very loose prior reacts fast but risks overfitting to noise; operational heuristics and validation should guide the chosen learning rate TrueSkill 2
Evaluating probabilistic forecasts: Proper scoring rules and calibration
Strictly proper scoring rules reward both calibration and sharpness and thus encourage honest probability estimates from forecasters; the Brier score and logarithmic score are standard choices because they are strictly proper and interpretable for probabilistic outcomes Strictly Proper Scoring Rules, Prediction, and Estimation
The Brier score measures the mean squared error between predicted probabilities and outcomes, while the logarithmic score penalizes overconfident errors more heavily. Both scores are practical to compute and compare across models, and they form the basis for objective model selection in forecasting workflows Verification of Forecasts Expressed in Terms of Probability
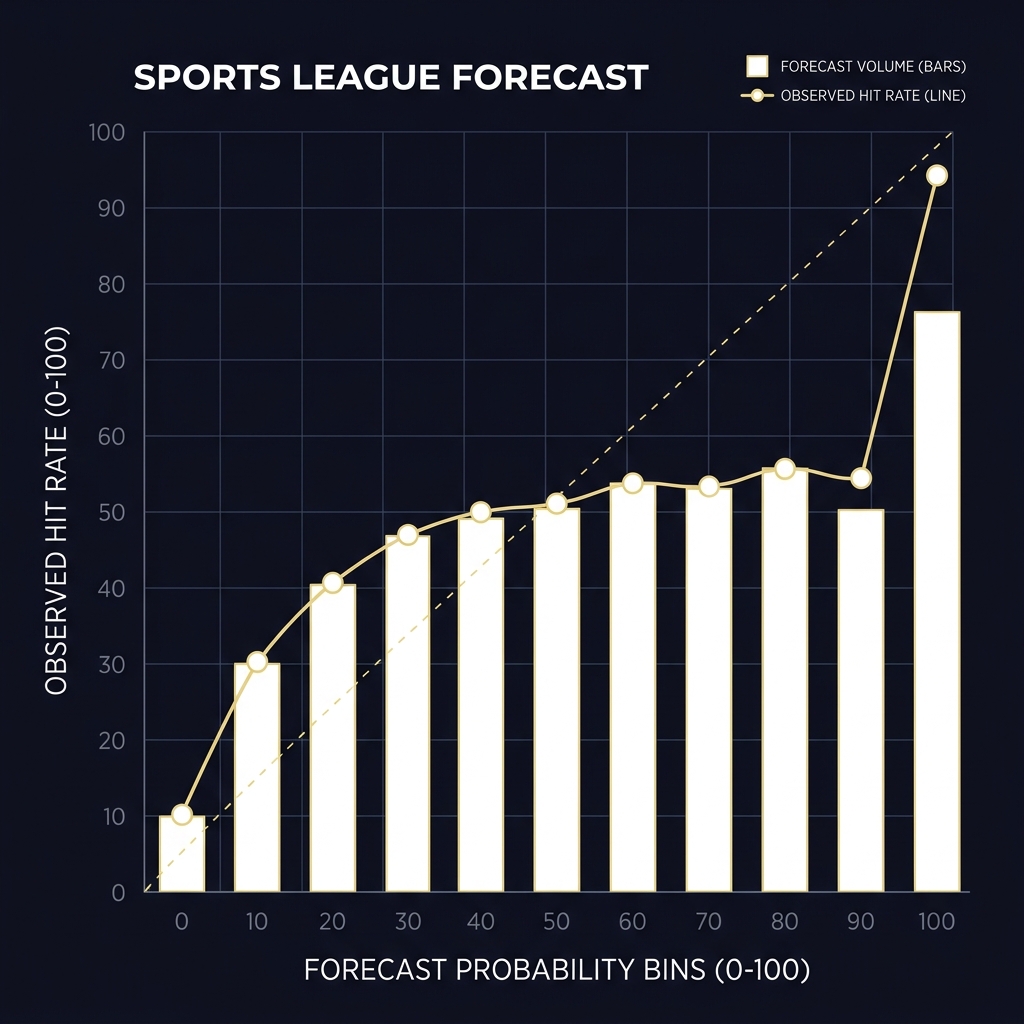
Reliability diagrams and calibration tests are essential diagnostics to check that predicted probabilities align with observed frequencies. Plotting forecast probability bins against empirical hit rates reveals systematic miscalibration and supports targeted recalibration or model changes when necessary Strictly Proper Scoring Rules, Prediction, and Estimation
Contextual adjustments: modeling league effects, home advantage, and injuries
Contextual covariates such as league structure and home advantage are commonly included as hierarchical effects so that base rates remain the backbone while allowing systematic differences to influence outcomes. Hierarchical covariates let modelers pool information across groups while preserving distinct group-level adjustments, a standard technique in applied Bayesian modeling Bayesian hierarchical model for the prediction of football results
Compute defensible historical base rates, express them as Bayesian priors, apply hierarchical pooling to stabilize small samples, update sequentially with observed outcomes using Bayesian updating, and validate with strictly proper scoring rules and reliability diagrams before deploying forecasts.
Schedule strength and cross-season differences are handled most robustly when incorporated as structured priors or explicit covariates rather than ad hoc multipliers; the advantage of this approach is that uncertainty in those adjustments is quantified and carried through to posterior probabilities Bayesian Data Analysis
For injuries and match-specific disruptions, conservative short-term adjustments are recommended. Treat match-day injuries as likelihood modifiers or temporary offsets rather than replacing priors, which preserves calibration and avoids overreacting to single events Bayesian hierarchical model for the prediction of football results
Decision criteria for model selection and when to trust base-rate-driven forecasts
Comparing models that lean more on base rates versus those that prioritize current signals should rely on out-of-sample validation with proper scoring rules. A model that produces better rolling Brier or log scores while maintaining calibration is typically preferable, regardless of whether it is more conservative or more aggressive in using recent data Strictly Proper Scoring Rules, Prediction, and Estimation
Sample size thresholds guide shrinkage choices: when a team or player has very few observations, hierarchical pooling should dominate and pull estimates toward the league mean; as sample size grows, team-specific signals can be allowed to exert more influence following principled shrinkage rules from Bayesian analysis Bayesian Data Analysis
Market-implied probabilities can be blended with computed priors when markets are deep and liquid, but blending should be validated by backtesting with proper scoring rules and accounting for market biases; prefer conservative blends when historical evidence is limited Bayesian Data Analysis
A practical workflow: from base rates to a deployable forecast (example with funded challenge context)
Step 1, gather historical results and compute league-level base rates using an agreed window and documented exclusions. Step 2, define hierarchical priors that reflect league averages and allow team-level deviations. Step 3, specify likelihoods for match outcomes and include contextual covariates like home advantage and schedule strength. Step 4, fit the model and evaluate with proper scoring rules and reliability diagrams. Step 5, deploy with monitoring and cautious update rules for sequential learning Bayesian Data Analysis

During evaluation challenges that simulate funded accounts, include checkpoints for drawdowns and maintain discipline on position sizes and model-led probabilities. Recording decisions and the model state at each checkpoint helps with later review and preserves a defensible audit trail for performance evaluation Bayesian Data Analysis
When deploying forecasts to a challenge environment, set clear metrics and stop conditions such as rolling Brier score thresholds and maximum acceptable drawdowns; these operational rules prevent reactive model changes and support consistent decision-making under stress TrueSkill 2
Common mistakes and pitfalls when using base rates
Overfitting to recent streaks is a common error. Abandoning priors after a short run of surprising outcomes produces unstable forecasts that degrade out-of-sample performance; the remedy is principled shrinkage and validation with proper scoring rules Bayesian Data Analysis
Ignoring structural changes such as rule adjustments or franchise moves can render historical base rates misleading. When such changes occur, either restrict the historical window or model the structural break explicitly so that priors remain defensible Bayesian Data Analysis
Confusing calibration with accuracy is another pitfall. A well-calibrated model may still fail to predict many individual games correctly, yet it will be superior in the long run when judged by proper scoring rules and average performance metrics Strictly Proper Scoring Rules, Prediction, and Estimation
Practical examples and scenarios: league-level, team-level, and market-implied base rates
Example 1, for low-data or new teams use league-level base rates as a default forecast to avoid extreme, unjustified probabilities. This stabilizes early forecasts until the team accumulates enough observations for partial pooling to reveal genuine signals Bayesian hierarchical model for the prediction of football results
Example 2, partial pooling shrinks extreme season estimates toward the league mean so that a single outlier season does not dominate forecasts; this is particularly useful when combining data across multiple seasons and competitions Bayesian Data Analysis
Example 3, blending market probabilities with computed priors can be sensible when market depth and historical validation support it; implement blends conservatively and test them with backtesting that uses proper scoring rules to ensure they improve calibration and sharpness Bayesian Data Analysis
Tools and practical resources for implementing base-rate-aware models
Common Bayesian modeling libraries and general purpose tools are available for building hierarchical models and computing proper scoring rules. Choose libraries that support hierarchical priors, efficient sampling or variational inference, and straightforward diagnostics for calibration Bayesian Data Analysis

Visualization and calibration tools such as reliability diagrams and rolling score calculators help operationalize monitoring. Provenance tracked historical results and cleaned datasets are essential inputs and should be versioned to enable reproducible base-rate computations Bayesian Data Analysis
Monitoring performance and detecting data drift
Operational metrics to track include rolling Brier score, calibration slope, and hit rates by probability bin. These metrics provide early signals that base rates or model calibration may be degrading and indicate when intervention is warranted Bayesian Data Analysis
Decisions to re-estimate base rates should be based on measured drift rather than single events. Define alerting rules tied to sustained metric changes and prefer measured, conservative recalibration over abrupt model redesigns TrueSkill 2
Testing changes: backtesting, cross-validation, and controlled experiments
Backtest probabilistic forecasts using proper scoring rules and time-aware cross-validation that prevents look-ahead bias. Rolling forward validation that holds out contiguous time blocks is a practical way to gauge real-world performance before live deployment Strictly Proper Scoring Rules, Prediction, and Estimation
Use controlled experiments or canary deployments to validate forecast changes on limited traffic. This reduces risk and gives empirical evidence about whether a change improves calibration or sharpness in live conditions Bayesian Data Analysis
A short list of dos and don'ts for base-rate-informed forecasting
Do anchor small-sample forecasts to base rates and apply hierarchical pooling when observations are scarce. Do validate changes with strictly proper scoring rules and reliability diagrams to ensure honest improvements in calibration Bayesian Data Analysis
Don't overreact to short-term streaks, and don't discard priors after a handful of surprising outcomes. Quantify and communicate uncertainty in published probabilities so users understand the limits of forecasts Strictly Proper Scoring Rules, Prediction, and Estimation
Conclusion: balancing stability and responsiveness with base rates
Base rates, understood as Bayesian priors, are essential for calibrated sports forecasting because they provide a stable reference that can be updated carefully as new information arrives. Combining priors, hierarchical pooling, dynamic updating, and proper scoring rules yields a coherent workflow for producing and validating probabilistic forecasts Bayesian Data Analysis
Open questions remain about the optimal pace of adaptation and how to detect genuine structural changes without overfitting to noise. The recommended approach is disciplined monitoring and conservative adjustments guided by scoring metrics and calibration diagnostics TrueSkill 2
Further reading and references
For deeper study consult core sources on scoring rules and Bayesian modeling, which together provide the theoretical and practical foundation for the techniques described here. These references remain central to implementing principled base-rate-aware forecasting workflows Strictly Proper Scoring Rules, Prediction, and Estimation
Base rates act as prior probabilities representing historical frequency; they combine with new evidence to form posterior probabilities in Bayesian updating.
Re-estimate when monitoring metrics show sustained drift in calibration or after structural changes such as rule updates or major format shifts.
Use strictly proper scoring rules like the Brier score or logarithmic score, and validate calibration with reliability diagrams.
References
- https://pmc.ncbi.nlm.nih.gov/articles/PMC11949986/
- https://www.taylorfrancis.com/books/mono/10.1201/b16018/bayesian-data-analysis-andrew-gelman-john-carlin-hal-stern-david-dunson-aki-vehtari-donald-rubin
- https://plato.stanford.edu/entries/bayes-theorem/
- https://doi.org/10.1080/02664760802684177
- https://www.microsoft.com/en-us/research/publication/trueskill-2-an-improved-bayesian-skill-rating-system/
- https://www.tandfonline.com/doi/abs/10.1198/016214506000001437
- https://doi.org/10.1175/1520-0493(1950)078<0001:VOFEIT>2.0.CO;2
- https://www.fundedplays.com/challenges
- https://www.fundedplays.com
- https://www.fundedplays.com/blogs/how-fundedplays-evaluations-work
- https://www.fundedplays.com/blogs
- https://www.frontiersin.org/journals/applied-mathematics-and-statistics/articles/10.3389/fams.2026.1754408/full
- https://link.springer.com/article/10.1186/s40621-025-00583-z