
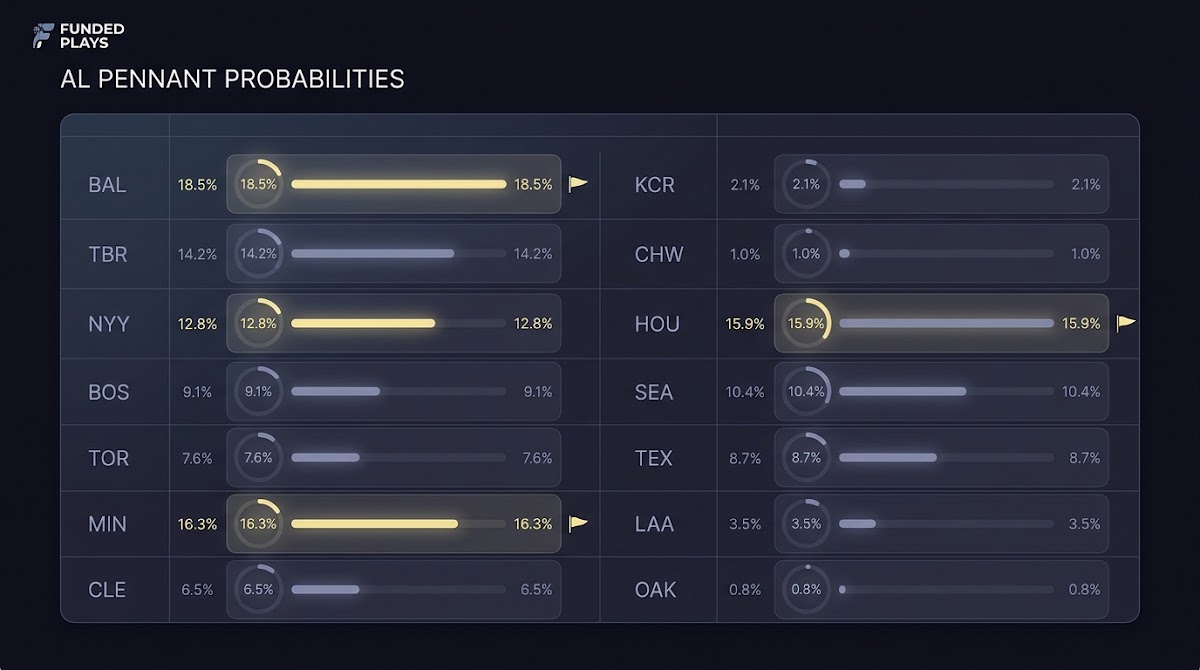
What the american league pennant odds actually measure
The term american league pennant odds refers to the probability that a specific team will win the American League pennant by season end, not the chance of winning a single game or a single playoff series. FanGraphs maintains daily projection-based pennant probabilities that readers often consult to see those season-level chances in context, and those outputs illustrate how models think about season outcomes FanGraphs Playoff Odds.
There are two broad sources for the numbers you will see: simulation-based projection models that run many season replays, and market prices collected from sportsbooks and aggregators. Market prices can be turned into implied probabilities with a conversion formula, but the raw market probabilities will usually embed a bookmaker margin and therefore not sum to 100 percent, which is important to keep in mind when comparing market prices to model outputs VegasInsider MLB pennant odds.
Models and markets answer slightly different questions. A public projection model reports a probability from thousands of simulated replays using current rosters and projected player performance, while a market price reflects where bettors and bookmaking operations place money and risk (SI betting coverage). Because of those different inputs and incentives, the same team can show a higher probability in a projection and a lower market price on the same day without either source being obviously wrong.

How projection models like FanGraphs and PECOTA estimate AL pennant chances
Inputs: depth charts, player projections, remaining schedule
Projection systems begin with baseline inputs such as current depth charts, individual player projections, and the remainder of the schedule; those inputs form the seed for season simulations. FanGraphs uses a depth-chart driven approach to generate team projections before running simulations that factor the remaining schedule, which is why model outputs change as team rosters and projected workloads change FanGraphs Depth Charts methodology.
ALCS odds quantify the probability a team wins the American League pennant over the rest of the season; interpret them as conditional, model- or market-based signals that update with roster changes, schedule context, and new information.
Simulation engines and what a probability means in practice
Once inputs are set, engines like PECOTA or the FanGraphs simulation engine run thousands of season replays and record how often each team finishes as pennant winner; that frequency becomes the published probability. Baseball Prospectus publishes PECOTA-based playoff odds that come from its own projection model and simulation engine, and methodological differences between PECOTA and other systems commonly produce distinct pennant chances on the same snapshot day Baseball Prospectus PECOTA playoff odds.

In practice, a 25 percent pennant probability from a projection means that in the simulated universe the model produced that team as league winner in one quarter of replayed seasons. The number is probabilistic and conditional on the model inputs; if the depth chart, injury status, or projection assumptions change, the simulated frequency will update accordingly.
Translating market AL pennant prices into implied probabilities
Market prices appear in formats such as decimal or moneyline style and can be converted to implied probability using standard formulas. For decimal odds the implied probability is 1 divided by the decimal price, and for moneyline-style quotes you first convert to decimal before inverting; learning the conversion lets you compare market-implied chances to model probabilities.
Because bookmakers include a margin or vig, the straight sum of implied probabilities from market prices will exceed 100 percent; you should adjust for that margin before comparing those market numbers to model outputs. A common simple adjustment is to divide each implied probability by the sum of all implied probabilities to scale them to 100 percent, which gives a cleaner benchmark against projection results Investopedia implied probability.

Practice converting real-market quotes into implied probabilities using a sportsbook aggregator and then apply a margin adjustment to see how the market view shifts; repeated practice with simulated challenges can help you build the conversion habit without risking real money (how Funded Plays evaluations work).
How to compare and benchmark model probabilities and market prices
Start by taking same-day snapshots from each source so you compare like with like; use the FanGraphs Playoff Odds page for model snapshots and a sportsbook aggregator for market prices to record concurrent values for each team FanGraphs Playoff Odds.
Second, convert market prices to implied probabilities and adjust for bookmaker margin before direct comparison to model outputs; that step prevents overstating market consensus simply because the raw implied numbers do not sum to 100 percent Investopedia implied probability.
Third, place model and market probabilities side by side and interpret the range. Expect differences because PECOTA and other projection systems use distinct assumptions, and markets reflect bettors and books as well as liquidity; treat divergence as a signal to dig for new information rather than immediate proof of an edge Baseball Prospectus PECOTA playoff odds.
Checklist to run a same-day comparison
- Capture the timestamped model numbers from a projection site.
- Record concurrent market prices from an aggregator and convert to implied probabilities.
- Apply a margin adjustment to market implied probabilities.
- Compare adjusted market numbers to projection outputs and note the largest divergences.
- Investigate why divergence exists, for example a recent roster move or an injury report.
For routine inspection, a simple table with columns for Team, FanGraphs probability, PECOTA probability, Raw market implied probability, and Margin-adjusted market probability is an effective format to spot meaningful spreads.

The role of injuries, trades, and roster changes in moving AL pennant odds
Official injury updates and roster transactions change both model assumptions and market sentiment because they directly affect player availability and expected performance; for official injury information consult the MLB.com injuries hub as the authoritative public source for day-to-day availability and statuses MLB.com injuries hub.
When a team loses a regular starter or acquires a proven bat or rotation arm, simulation-based probabilities update because the underlying projected contributions change, and market prices will often move as bettors and books reprice; the timing and magnitude of change differ by source and by the perceived permanence of the roster event.
Track roster events that affect pennant odds
Update each row when a new official report appears
If a key starter suffers a multi-week injury, a model recalculation will show reduced pennant frequency for that team because the simulated seasons now reflect the absence and replacement-level performance. Markets may react faster or slower depending on how widely the report is disseminated and how confident money is that the change is long lasting.
Track both model pages and official transaction feeds after any material roster report. That practice helps you see whether probabilities are moving due to a verifiable roster change or merely because of short-term randomness in results.
Common mistakes when reading or relying on pennant odds
A frequent error is treating raw market implied probabilities as an unbiased measure without adjusting for bookmaker margin; the unadjusted figures overstate consensus probabilities because the vig inflates the sum. Before using market numbers as a benchmark, normalize them to remove the margin effect Investopedia implied probability.
Another mistake is overreacting to short-term team form or a single injury without checking whether projection inputs and schedules materially change. Projection systems already fold schedule and projected workloads into their simulations, so a few hot or cold weeks may have less long-term effect than headlines imply FanGraphs Playoff Odds.
Quick checks to avoid misreading odds include confirming the data timestamp, verifying the roster status on an official injuries feed, and comparing both a projection model and a market aggregator before declaring a new consensus.
Worked examples: converting Vegas prices and comparing to FanGraphs and PECOTA
Example conversion steps. Suppose an aggregator lists Team A at decimal price 4.50 for the AL pennant. Convert decimal to implied probability by calculating 1 divided by 4.50, which gives about 22.2 percent before any margin adjustment; that conversion practice is how you translate a market price into a readable percentage view VegasInsider MLB pennant odds.
To adjust for vig across several teams, first compute implied probabilities for each market price, sum them, and then divide each team implied probability by that sum to rescale to 100 percent. For example, if three teams' raw implied probabilities sum to 115 percent, divide each raw number by 1.15 to get margin-adjusted percentages that are comparable to projection outputs Investopedia implied probability.
Two-team comparison example. Take a same-day snapshot where FanGraphs lists Team A at 24 percent and PECOTA lists Team A at 20 percent. If the margin-adjusted market probability is 22 percent, the range from 20 to 24 percent is reasonable given different model assumptions, but a wider gap might prompt you to look for a recent roster announcement or a divergent schedule assumption that explains the spread FanGraphs Playoff Odds.
What the divergence suggests. For an analyst, consistent model-market divergence could be an invitation to test the projection inputs or to check whether markets are pricing factors the model does not, such as bullpen health or travel-heavy scheduling. For a casual fan, the practical takeaway is that varying sources create a range of probabilities; use ranges rather than single-point numbers to set your expectations.
Bottom line and practical monitoring plan for staying current on american league pennant odds
Practice disciplined forecasting with the FundedPlays Challenges description
Follow a short daily routine to capture model snapshots, market prices, and official roster updates so you can spot consequential movements without overreacting.
Monitoring pennant probabilities is most useful when you follow a disciplined, repeatable process that balances projections, markets, and official news. The routine below helps you gather the evidence you need to interpret movements thoughtfully. (see our blog)
Five-step daily check routine
- Open FanGraphs Playoff Odds and record the timestamped pennant probabilities for each American League team. (also check ESPN MLB futures for a market snapshot)
- Pull concurrent market prices from a sportsbook aggregator and convert them into implied probabilities.
- Adjust market implied probabilities for bookmaker margin so the market numbers scale to 100 percent.
- Check the MLB.com injuries hub for any official roster or availability updates that could explain model or market movements.
- Log any major divergences and set a follow-up time to see if the difference persists or narrows after new information.
How often to check. During active transaction windows or after major injuries, check at least daily. In quieter stretches check two or three times a week to maintain a trend log without treating normal day-to-day noise as meaningful.
When to dig deeper. If a team's model probability shifts more than a few percentage points on a single update, or if margin-adjusted market prices diverge substantially from projection consensus, inspect roster pages and recent transaction notes to find the mechanistic cause rather than assuming the numbers are wrong.
Remember that odds are probabilistic signals, not predictions of a single outcome. Use projections and market prices as inputs to disciplined forecasting rather than as guarantees of result, and keep a short log of the reasons behind large moves to support measured decisions. (Funded Plays)
Convert decimal odds to implied probability by calculating 1 divided by the decimal price. For moneyline-style quotes convert to decimal first. Then adjust all implied probabilities for bookmaker margin so they sum to 100 percent before comparing to projection models.
Use FanGraphs Playoff Odds and Baseball Prospectus PECOTA for projection snapshots, and a reputable sportsbook aggregator for market prices. Cross-check roster status on the official MLB injuries feed.
Neither is an absolute truth. Models show how often a simulated season produces a pennant winner given input assumptions. Markets reflect investor and bettor preferences and embed a bookmaker margin, so use both sources together to form a probabilistic view.