
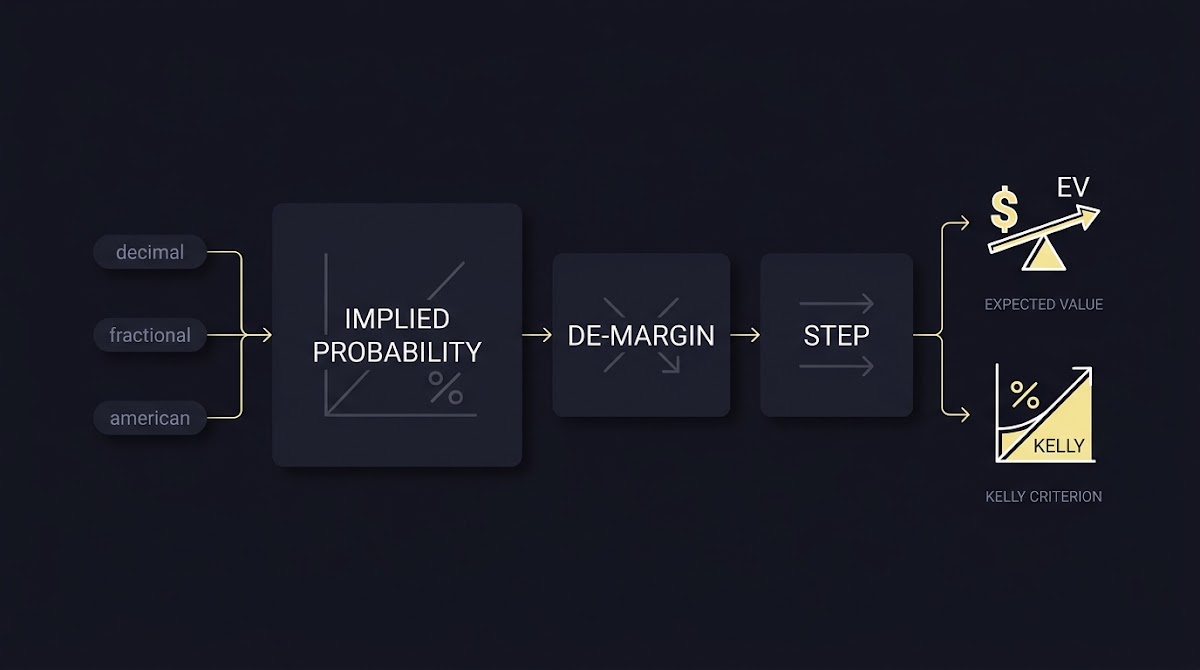
A Practical Guide to Probability-Based Sports Trading: Core definitions and context
A Practical Guide to Probability-Based Sports Trading begins with clear definitions so you can turn market prices into decision-ready probabilities and sensible stakes. Start by understanding implied probability, which converts bookmaker odds into a percentage chance and shows why markets include a house margin that must be accounted for when you seek value Implied probability definition and formula. Tools such as OddsJam's implied probability calculator can help with quick conversions.
Odds come in decimal, fractional and American formats, and each maps to an implied probability using a standard formula; knowing those mappings is the first step toward fair pricing and systematic trading Vigorish explanation and market margin.
Spreadsheet template for odds conversion and EV calculation
Keep one line per market
In practical probability-based trading you treat the market as informative but not infallible. Expected value is the decision metric that tells you whether a trade has a statistical edge, and sensible staking and risk controls are the second pillar that preserves capital through variance Expected value primer.
What probability-based sports trading means
Probability-based trading is a discipline where you convert prices into probabilities, compare those probabilities with your model or judgement, and act only when you find positive expected value. The approach prizes repeatable processes and clear record keeping rather than predictions of guaranteed outcomes Foundational staking and information framework.
Key terms to know: odds, implied probability, overround, EV, bankroll
Odds are the market expression of payout; implied probability is the inverse mapping from odds to percentage chance. The overround, sometimes called the vig or vigorish, is the amount by which the summed implied probabilities exceed 100 percent and reflects the bookmaker house margin Vigorish explanation and market margin.

Expected value, or EV, is the product of your assessed probability edge and the net payout you will receive; positive EV means a favourable long-run expectation, though it does not remove short-term variance Expected value primer.
A Practical Guide to Probability-Based Sports Trading: Converting odds to implied probability and de-margining
Converting common odds formats to implied probability is routine: for decimal odds, implied probability is 1 divided by the decimal price; for fractional odds A/B, convert to decimal by (A divided by B) plus 1 and then invert; for American odds, positive and negative forms map to different formulas depending on sign. These conversions are the standard starting formulas traders use to compare markets Implied probability definition and formula, or use a calculator like The Rundown's converter.
Formulas for decimal, fractional and American odds
Use the decimal formula when prices are shown as total payout per unit stake, invert the decimal price to get implied probability, and apply the fractional-to-decimal conversion when necessary. For American odds, convert the sign-specific number into an equivalent decimal first, then invert to implied probability. These translations let you compare different markets and book formats on the same probabilistic footing Implied probability definition and formula. See an odds converter such as Omni Calculator for quick checks.
How the bookmaker margin appears in implied probabilities
When you compute implied probabilities across all mutually exclusive outcomes the summed probabilities frequently exceed 100 percent; that excess is the overround and represents the bookmaker margin that must be removed to estimate fair probabilities for EV analysis Vigorish explanation and market margin.
Recognizing the overround is practical: if you use raw implied probabilities without de-margining you will systematically understate potential edges because the market price embeds the house take. Removing vig is therefore an essential pre-step before you compare market-implied numbers with your own model estimates Vigorish explanation and market margin.
Practical de-margining methods (proportional, consensus-book approach)
A commonly used de-margining method scales the raw implied probabilities proportionally so their sum equals 100 percent; this proportional approach assumes the bookmaker's margin is distributed evenly across outcomes and produces a simple fair-price estimate for downstream EV work Vigorish explanation and market margin.
Alternative methods use market consensus or more targeted adjustments when you suspect the vig is concentrated on specific outcomes. Any de-margining approach requires an assumption about how the house margin is applied, and you should document the assumption when you backtest or present results Vigorish explanation and market margin.
Probability estimation methods for sports events
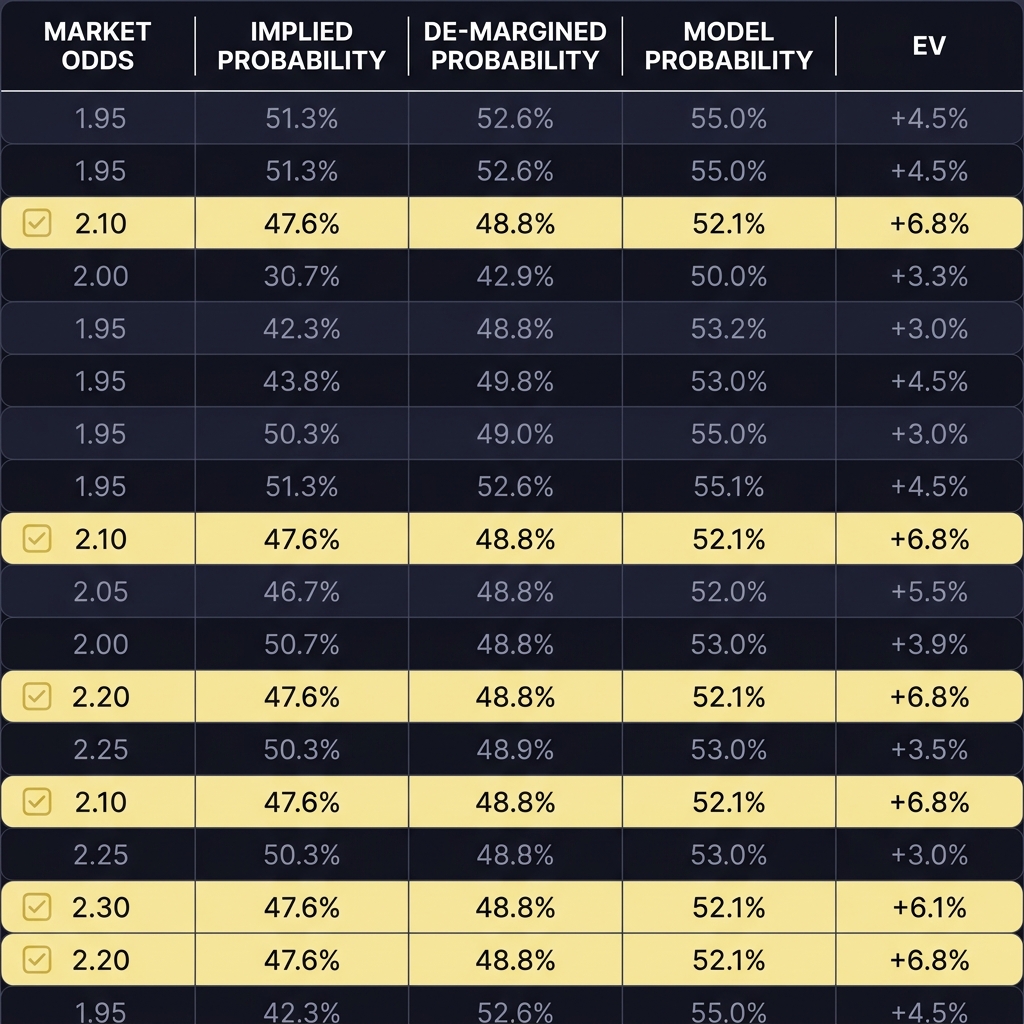
Estimating true probabilities is the modelling core of probability-based trading. Start with simple frequency-based estimates or rating systems as baselines; these provide robust comparisons and help you detect model overfitting before moving to more complex probabilistic frameworks Poisson model foundations and practical guidance.
For low-scoring sports such as association football, Poisson goal models are a standard choice because goals are count data with many low values, and the Dixon Coles adjustment refines the fit for paired low-score outcomes like draws and 0-0 results Poisson model foundations and practical guidance.
Quick checklist and model template for probability-based trading
Download a one-page checklist or model template to apply Poisson and simple de-margining steps in your own spreadsheet.
When your model produces probabilities, combine them with market-implied and de-margined prices as a benchmark. Model outputs outperform raw market odds most often when you have high-quality data, a well-calibrated model, and a persistent edge; otherwise the market price is the safer reference Poisson model foundations and practical guidance.
Simple frequency and rating-based approaches
Frequency-based approaches compute empirical win rates from historical data and are easy to implement and interpret. Rating systems such as Elo or other strength indices add context by adjusting for opponent quality and venue, which improves probability estimates compared with raw frequencies alone Foundational perspective on rating frameworks.
Poisson models for low-scoring sports and Dixon Coles adjustments
Poisson goal models estimate the probability of each possible scoreline by treating goals as independent count events with team-specific scoring rates; the Dixon Coles adjustment corrects for dependence between low-scoring outcomes and yields better-calibrated probabilities for draws and goalless matches Poisson model foundations and practical guidance.
When to prefer modelled probabilities over raw market odds
Model probabilities are most useful when you can show consistent out-of-sample calibration gains versus market-implied probabilities after de-margining. If your model cannot beat a hold-adjusted market benchmark in backtests, the market will often be the better guide for live decisions Recent industry hold context.
Model calibration, data quality and benchmarking
Calibration is how well predicted probabilities match observed frequencies; a well-calibrated model that forecasts 30 percent outcomes should see those outcomes occur roughly 30 percent of the time in the long run. Calibration plots and reliability metrics are practical tools to assess this alignment Statistical modelling guidance.
Good calibration is essential because EV calculations depend on the accuracy of estimated probabilities. If your model is poorly calibrated, even a correctly computed EV can mislead decisions and produce losses in aggregate Expected value primer.
Assessing calibration and discrimination of probability models
Calibration checks whether forecast probabilities match observed frequencies, while discrimination evaluates whether the model separates high-probability outcomes from low-probability ones. Both properties matter: poor discrimination limits where you can find value, and poor calibration corrupts EV estimates Statistical modelling guidance.
Data sources, cleaning and feature selection
Common data issues include missing event times, inconsistent team names, stale odds timestamps, and biased historical samples. Practical mitigations are consistent ingestion rules, canonical team mapping, and keeping the odds timestamp used for decision making in your record log Industry data and market timing context. See the evaluation process for an example of structured records.
Benchmarking against market odds and hold-adjusted comparisons
Benchmarks should use de-margined market probabilities so the comparison is apples-to-apples. Track both calibration and profit-and-loss versus a hold-adjusted market baseline to see whether model improvements yield economic value after accounting for vig and friction Vigorish explanation and market margin.
Calculating expected value and measuring edge
Expected value is the core decision metric: compute EV as the estimated win probability times the net payout minus the chance of losing times the stake, or more simply the probability times net return per unit. Positive EV identifies a long-run advantage if your probabilities are accurate Expected value primer.
When you compute EV, be sure you use net payout after any house margin or transaction costs; failing to account for juice or other fees will bias your EV upward and misstate the true edge Vigorish explanation and market margin.
Convert odds to implied probabilities, remove the bookmaker margin using a de-margining method, compare the de-margined market probability to your model probability, compute expected value including net payout and fees, then apply a disciplined staking rule and log the outcome for review.
Translate your estimated model probability and de-margined market price into a practical test EV and log the result for a recent market line to build confidence in live decisions. Use this exercise to check whether your process captures costs and calibration issues before you commit real bankroll.
Expected value (EV) formula and interpretation
Write EV as EV = p * R - (1 - p) * 1 for unit stakes where p is your estimated probability and R is net return on a winning unit. A positive EV suggests a favourable trade in expectation, but it is not a guarantee for any single outcome Expected value primer.
Translating probability estimates into positive EV opportunities
To find opportunities, compare your model probability with the de-margined market-implied probability. If your probability implies a higher true chance than the fair market price, and the EV calculation remains positive after netting out fees, you have an identifiable edge Vigorish explanation and market margin.
Practical considerations: net payout, juice and transaction costs
Include net payout, commission, and any platform-specific fees in your EV calculations. Markets may appear attractive on headline payouts but can become marginal or negative after these practical costs are included Vigorish explanation and market margin.
Staking strategies: the Kelly criterion and practical fractions
The Kelly criterion gives a formula for the fraction of bankroll that maximizes long-run growth under specific assumptions about repeated independent bets and known edge; it is a valuable theoretical guide for stake sizing when those assumptions roughly hold Foundational staking and information framework.
Full Kelly can be volatile in practice because it magnifies estimation error and variance; many traders use fractional Kelly (for example half Kelly) to reduce drawdowns while retaining some growth benefit from using an edge estimate Foundational staking and information framework.
Deriving the Kelly fraction and intuition behind it
Kelly calibrates stake size based on edge and odds so bets that offer more relative advantage receive larger stakes. The intuition is to balance expected growth against ruin probability by sizing stakes proportionally to the estimated edge divided by odds variance Foundational staking and information framework.
Why pure Kelly can be volatile and when to use fractional Kelly
Kelly reacts strongly to estimation noise; if your probability estimates have error, full Kelly can recommend stakes that cause deep drawdowns before a correction occurs. Fractional Kelly is a pragmatic compromise that reduces recommended stake sizes and smooths downside risk while preserving some growth advantage Foundational staking and information framework.
Practical staking rules and alternatives (fixed fraction, volatility-adjusted sizing)
If Kelly feels too sensitive, use fixed fraction sizing where you risk a small percent of your bankroll per qualifying trade, or adjust sizes based on recent volatility of outcomes. The goal is consistent, documented sizing rules that you follow through losing runs Foundational staking and information framework.
Bankroll management, drawdowns and operational risk controls
Set explicit bankroll rules up front: define a starting bankroll, a maximum percentage risk per trade, and conservative drawdown stop levels to protect capacity for meaningful sample sizes. Documenting these rules reduces ad hoc risk taking and helps preserve statistical testing power Foundational staking and information framework.

Operational controls are equally important: keep a timestamped trade log, record the odds and source you used for each decision, and review performance regularly so you can detect calibration drift or data issues before they erode your edge Industry data and monitoring context. For a concrete example of record-keeping and structured reviews see our blogs.
Setting bankroll rules and tiered risk limits
Tier your risk limits by account size and strategy volatility. Smaller accounts need lower percent risk per trade to survive variance, while larger accounts can tolerate higher absolute stakes but should still follow percentage-based rules to control drawdown risk Foundational staking and information framework.
Handling strings of losses and drawdown thresholds
Prepare for inevitable losing streaks by using drawdown thresholds that trigger a review or temporary reduction in sizing. Fractional staking and formal stop rules are practical ways to limit the depth and duration of adverse runs Foundational staking and information framework.
Operational controls: logging, execution discipline and monitoring
Log every decision, including model probability, de-margined market price, EV calculation, stake size and result. Discipline in execution allows meaningful backtests and supports continuous improvement when you routinely compare logged outcomes to expectations Industry data and monitoring context.
Decision criteria and trade filters: building a disciplined workflow
Translate probability and EV signals into actionable rules: require a minimum edge, check line freshness and liquidity, and ensure model confidence thresholds are met before placing a trade. A simple checklist turns judgement into repeatable actions Expected value primer.
Checklist for a valid probability-based trade
A compact checklist should include: de-margined market probability, model probability, computed EV, stake suggestion from your sizing rule, and a liquidity check. Require each item to be satisfied before execution so you avoid ad hoc bets that violate your process Vigorish explanation and market margin.
Filter rules (minimum edge, model confidence, liquidity)
Set a minimum edge threshold that accounts for both estimation uncertainty and transaction costs. Higher thresholds for thin markets or low-confidence models help avoid wasting bankroll on marginal edges that vanish after fees or slippage Expected value primer.
Record-keeping and review cadence
Review results on a cadence that matches your activity level: weekly reviews for active traders, monthly for lower-frequency work. Use logged outcomes to recalibrate models, re-evaluate thresholds, and update staking if practical performance diverges from expectations Industry data and monitoring context.
Common mistakes and pitfalls in probability-based sports trading
Overfitting and data-snooping are common errors: building a model that captures noise rather than signal will look excellent in-sample but fail out of sample. Always validate on held-out data and prefer simple models until you have sufficient evidence to increase complexity Statistical modelling guidance.
Ignoring vig, transaction costs and market friction turns apparent positive edges into losses. Always de-margin and include all fees before deciding a trade has value Vigorish explanation and market margin.
Behavioral mistakes such as chasing losses, increasing stakes after runs of bad luck, or abandoning documented rules are often what turns a good process into a losing one. Pre-defined sizing and automated checks reduce these risks Foundational staking and information framework.
Practical worked examples and scenarios
Step 1: Convert the market odds into implied probabilities using the appropriate formula. Step 2: De-margin the implied probabilities to get a fair market benchmark. Step 3: Compare the de-margined market probability to your model probability. Step 4: Compute EV and apply your stake sizing rule. Step 5: Log the decision and result for later analysis Implied probability definition and formula.

For football, a Poisson plus Dixon Coles workflow maps team scoring rates into a distribution of scorelines and then sums those scoreline probabilities to get outcome probabilities for home win, draw and away win. Use that distribution to compute model probabilities for EV comparisons with de-margined market prices Poisson model foundations and practical guidance.
Deciding to pass can be as important as deciding to act. If your model indicates only a tiny positive EV but liquidity is low or your confidence in the input data is weak, it is sensible to skip the trade and preserve bankroll for clearer opportunities Expected value primer.
Conclusion: putting probability-based sports trading into practice
Three pillars matter: accurate probability estimates, honest EV calculations that include vig and costs, and disciplined staking with operational controls. These combine to make probability-based trading testable, auditable and repeatable Expected value primer.
Start small with backtests and paper trials, keep meticulous logs, and apply conservative sizing until you can show consistent, benchmark-beating performance after fees and vig. Remember that models and rules reduce uncertainty but do not remove it; outcomes depend on calibration, data quality and execution discipline Industry data and monitoring context. See Funded Plays for challenges and programs to practise within constrained risk limits.
Convert decimal odds by inverting the decimal price; convert fractional odds to decimal first then invert; convert American odds to decimal then invert. Use de-margining to adjust for the house take.
Expected value measures the long-run average outcome from a bet based on your estimated probability and net payout. Positive EV suggests a statistical edge but does not guarantee short-term success.
Full Kelly maximizes theoretical long-term growth but can be volatile; many practitioners prefer fractional Kelly or fixed fraction rules to reduce drawdowns.
References
- https://www.investopedia.com/terms/i/implied-probability.asp
- https://oddsjam.com/betting-calculators/implied-probability
- https://www.investopedia.com/terms/v/vigorish.asp
- https://www.investopedia.com/terms/e/expectedvalue.asp
- https://ieeexplore.ieee.org/document/1056803
- https://rss.onlinelibrary.wiley.com/doi/10.1111/1467-9876.00065
- https://therundown.io/betting-calculators/implied-probability-calculator
- https://www.omnicalculator.com/statistics/implied-probability
- https://www.americangaming.org/research/commercial-gaming-revenue-tracker/
- https://www.fundedplays.com/challenges
- https://www.fundedplays.com/blogs/how-fundedplays-evaluations-work
- https://www.fundedplays.com/blogs
- https://www.fundedplays.com