

What a beginner sports analytics toolkit is and why it matters
Definition and scope
A Beginner’s Sports Analytics Toolkit is a compact, learnable set of practices, files, and tools that lets a newcomer move from raw CSVs or spreadsheet exports to a reproducible predictive workflow that can be inspected and repeated. This toolkit focuses on reproducible workflows, data ingestion, basic feature definitions, baseline models, and clear evaluation so that a small project is useful for learning rather than positioned as advanced research.
The practical scope is narrow on purpose: a beginner toolkit prioritizes clear steps and repeatability over experimental model complexity. It covers data ingestion and cleaning, defining a few core features that match official stat definitions, training a baseline classifier, and saving results and documentation so someone else can reproduce the outcome, which helps when sharing work with peers or entering structured prediction challenges.
Hobbyists, fantasy players, and novice analysts benefit most from a starter toolkit because it reduces the noise around tool choice and teaches good habits early. See Funded Plays for challenge resources.
As a short example: a weekend exercise might take a play-by-play CSV, map a small set of features to official stat terms, train a logistic regression to predict a binary outcome, and produce a short README that records the data source and the exact command to re-run the pipeline.
Core principle: reproducible workflows, version control, and documentation
Why reproducibility matters
Reproducible analytical workflows make work inspectable, reduce accidental errors, and let you return to a project months later without losing the steps that produced results; these practices align with modern open-science guidance and are recommended for analytics projects in 2026, especially when you are learning or sharing results The Turing Way handbook.
For beginners, reproducibility means scripted steps rather than ad-hoc clicks, a clear record of where raw data came from, and a short README that explains how to recreate the environment and run the analysis. Practically, this reduces the risk that a curious tweak will silently change model performance or that a collaborator cannot reproduce your numbers.

Beginner-friendly actions include initializing a git repository, keeping raw data in a separate data/ folder that is not committed directly, adding a run script that chains cleaning, feature extraction, modeling, and report generation, and saving an environment specification so others can match library versions.
Checklist items to track in every small project are: data provenance (where the file came from and its checksum), metric definitions (exactly how outcomes and metrics are computed), and a reproducible command that runs the full pipeline from rawCSV to final results. Keeping these items up front converts casual notes into a reliable, repeatable process.
Use a reproducible checklist with FundedPlays Challenges
Copy the reproducible checklist in this section into your project README to ensure data provenance, metric definitions, an environment file, and a single run command are recorded before modelling.
Languages and interfaces: Python, Excel, and a spreadsheet-first path
When to start in Excel
Many beginners find spreadsheets comfortable for initial exploration because Excel provides immediate visual feedback and a low barrier to opening CSVs, filtering rows, and quickly checking distributions. Since 2024, Excel includes a native Python integration that lowers the barrier for people who begin in spreadsheets and want to test small scripts without leaving a familiar interface Microsoft Excel blog.
Starting in Excel is especially useful for quick sanity checks, lightweight pivot-style summaries, and for teams where one member is comfortable with spreadsheets while another prefers code. Use Excel as a place to inspect and document column meanings before migrating to a scripted workflow.
When to move to Python
Move to Python when you want repeatable transformations, versioned scripts, or to use libraries that simplify modeling and evaluation. Python brings a mature ecosystem for data analysis and machine learning, making it the practical next step once you are ready to automate cleaning and run baseline models.
For a smooth transition, export a cleaned CSV from Excel with documented column names, then load that file into a Python script or notebook that uses pandas-like dataframes to reproduce the same transforms in a repeatable way. This hybrid path keeps the initial user comfort while introducing reproducible code.
Starter stack: libraries, tools, and a minimal reproducible setup
Recommended libraries
A minimal, copyable set for a beginner project includes tools for CSV/Excel ingestion, pandas-style dataframes for cleaning, scikit-learn for baseline models and evaluation utilities, and a small plotting library for quick visual checks. These libraries provide a stable foundation for reproducible work and accessible baseline modeling workflows scikit-learn what's new.
Concretely, think: pandas or a pandas-compatible read path that accepts Excel or CSV, scikit-learn for train/test split and cross-validation, matplotlib or a lightweight plotting helper for diagnostics, and a simple environment file such as requirements.txt or environment.yml to record versions.
a short reproducibility checklist for a starter script
include a single run command that recreates the results
Project layout that beginners can copy is intentionally simple: data/ for raw and processed files, notebooks/ for exploratory work, src/ for scripts that run reproducible transforms, results/ for model outputs, and a README with the run command. Add a run script at the repository root that executes the essential steps so others can reproduce the pipeline with one command.
Keep raw files separate, store intermediate processed files only if they speed up iteration, and record checksums for downloaded files. These small discipline choices pay off as projects grow in complexity and when you need to compare model runs.
Practical data sources and standards to practice with
Official data and labeled practice datasets
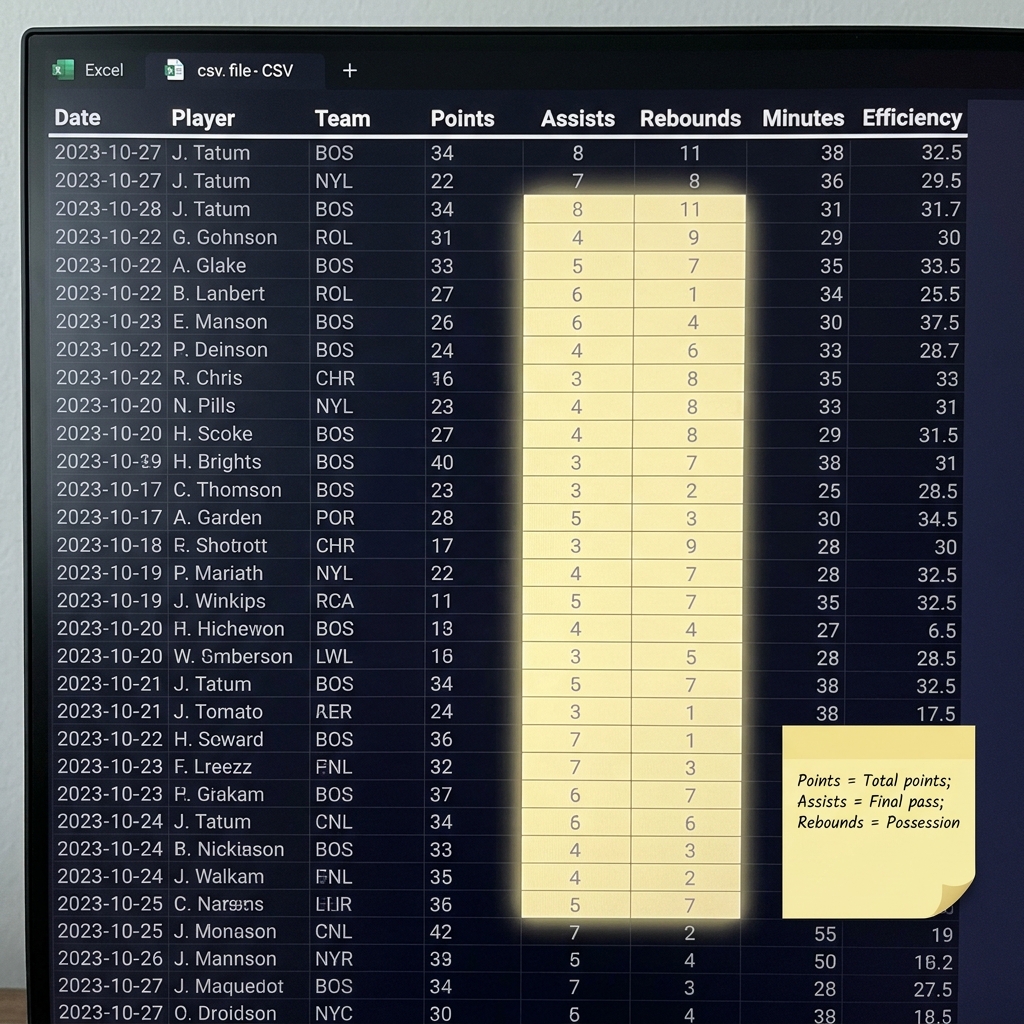
High-quality, labeled practice data is released through official challenges and competitions, which are excellent for supervised learning practice because they include realistic features and clear evaluation objectives; one recent example is the NFL Big Data Bowl competition page, which provides datasets designed for beginner and intermediate projects NFL Big Data Bowl competition page.
Using challenge datasets for a first project reduces friction because the data is usually documented and intended for public use; you can also see the 2026 competition page NFL Big Data Bowl 2026.
Aligning feature definitions to official stat-keeping manuals improves interpretability and consistency; for instance, mapping play-level fields to the definitions in official statisticians' manuals ensures feature names reflect standard meanings rather than ad-hoc calculations NCAA statisticians' manuals.
Before modeling, inspect the dataset README and any provided metadata, confirm column definitions against authoritative references where available, and record how you derived any new features so your transforms remain transparent and reproducible.
A step-by-step beginner project you can finish in a weekend
Project overview
The project scope is intentionally focused: predict a simple binary outcome from a play-by-play or event CSV using a baseline classifier and report cross-validated performance. The goal is reproducibility and learning, not producing a state-of-the-art model.
Suggested scope items are: a small feature set that maps to official definitions, a logistic regression baseline, k-fold validation for stable estimates, and a brief README that records data provenance and the exact command used to run the example.
Step checklist from raw CSV to evaluated model
1) Ingest the CSV or Excel export into data/raw and record the source and checksum. 2) Create a preprocessing script that documents each transform and writes processed files to data/processed. 3) Define a small feature CSV where each column is explicitly mapped to an official stat term or a short derivation note. 4) Split data with a reproducible random seed, or use k-folds for evaluation. 5) Train a logistic regression baseline with scikit-learn and save the fitted model and evaluation metrics. 6) Save a results report and add a run command to the README that reproduces all steps.
These steps are intentionally compact so you can complete them in a concentrated period and still practice version control, environment pinning, and reproducible reporting. Make the run script call the preprocessing, training, and reporting scripts in order so one command rebuilds the results from raw files.

Model evaluation, metrics, and avoiding common statistical traps
Which metrics to pick and why
Choose metrics that match your prediction task and the practical goals for the model; for a binary classifier consider accuracy only when classes are balanced, and prefer precision-recall or area under the ROC curve when class balance or ranking are important. Use scikit-learn utilities for consistent metric calculations and comparisons.
Reliable baselines and consistent metrics are critical because they prevent overinterpreting small performance differences. Use the same metric across experiments and record the exact scikit-learn call or function used so comparisons remain reproducible scikit-learn what's new.
Simple cross-validation and baseline comparisons
Implement k-fold cross-validation for a stable baseline and avoid leaking future information into training splits by carefully selecting features and respecting time order for temporal data. A common default baseline is logistic regression evaluated with k-fold cross-validation and a consistent random seed to ensure runs can be repeated.
An example of data leakage to avoid: computing a normalization parameter across the entire dataset before splitting will leak information from the test fold into training. Instead compute normalization parameters within each training fold and apply them to the corresponding validation fold.
Decision criteria: choosing tools, datasets, and how deep to go
Simplicity versus extensibility
Decide whether to prioritize a minimal reproducible setup or a more extensible stack based on your goals. If your objective is learning and reproducibility, favor simple tools that are easy to explain and version; if you need production-ready performance, plan for more sophisticated tooling and testing.
Factors to weigh include the required evaluation rigor, the complexity of the dataset, and how much automation you need to reproduce experiments. Keep a short decision note in your README that records why you chose a given layout so future work can follow the same rationale.
Public challenge datasets are ideal for practice because they come with documentation and often an intended evaluation approach; the official NFL Big Data Bowl page provides context 2026 NFL Big Data Bowl.

If you consider proprietary sources, verify permitted use and document provenance carefully in your README. When reproducibility and sharing are priorities, public datasets keep the pathway clear for collaborators and reviewers.
Typical mistakes and how to avoid them
Reproducibility mistakes
Common reproducibility mistakes include missing run scripts, failing to record environment versions, and storing only processed files without the transforms that created them. A lightweight remedy is to add a single run command to the README, commit scripts to version control, and include an environment file to pin dependencies.
Early discipline on provenance and documentation prevents confusion later and is consistent with reproducible-data best practices recommended for analytics projects The Turing Way handbook.
Modeling and interpretation pitfalls
Modeling errors beginners often make are overfitting small datasets, ignoring official stat definitions when creating features, and misinterpreting probabilities as deterministic predictions. Counter these problems by using simple baselines, performing k-fold validation, and documenting how each feature was computed.
For example, if a model seems to do very well on a small sample, check whether the evaluation split accidentally reused the same game or player identifiers across folds; if so, adjust the split strategy to respect the natural grouping in the data.
Example 1: A Big Data Bowl baseline. Use a provided play-level CSV, map a small set of features to official stat terms, train a logistic regression to predict a binary event, and produce cross-validated metrics and a short README that lists the run command and data source. Example 2: Feature extraction practice. Take play-by-play logs, write a preprocessing script to produce per-play features, and compare simple aggregations with a baseline classifier to practice reproducible feature engineering.
Both examples emphasize clear documentation of data provenance and an explicit run command so others can reproduce your results without asking for clarification.
Start with a documented data source, keep raw files separate, script cleaning and feature steps, use version control, pin environment versions, train a simple baseline with reproducible evaluation, and save a single run command that rebuilds results.
Final reproducibility checklist to finish and share: verify data provenance and checksums, record metric definitions, include an environment file, add a run script that executes preprocessing, training, and reporting, and push the repository with an explicit README that documents intended evaluation and permitted data uses The Turing Way handbook.
Suggested next steps after finishing these exercises are iterating on feature ideas, comparing a few different baseline models, and entering official challenges to practice under evaluation constraints. Joining a public challenge helps you see how reproducibility and clear documentation matter when peers inspect results. See the Funded Plays blog.
Start with a documented CSV, pick a small set of features, train a simple baseline like logistic regression with k-fold validation, and record a run command and environment file so results are reproducible.
No, you can start in Excel for exploration and use Python in Excel or export a cleaned CSV to Python when you are ready to script reproducible transforms.
Public competitions and challenge datasets provide well-documented practice files; inspect the dataset README and any official stat references before modeling.
References
- https://the-turing-way.netlify.app/welcome
- https://techcommunity.microsoft.com/t5/excel-blog/python-in-excel-now-available-to-all-enterprise-customers/ba-p/4159709
- https://scikit-learn.org/stable/whats_new/v1.4.html
- https://www.kaggle.com/c/nfl-big-data-bowl-2025
- https://www.ncaa.org/sports/2013/11/19/statisticians-manuals.aspx
- https://www.fundedplays.com/challenges
- https://www.fundedplays.com
- https://www.fundedplays.com/blogs/how-fundedplays-evaluations-work
- https://www.kaggle.com/competitions/nfl-big-data-bowl-2026-analytics
- https://operations.nfl.com/programs-initiatives/innovation/big-data-bowl
- https://aws.amazon.com/sports/nfl-big-data-bowl/
- https://www.fundedplays.com/blogs