
Short answer and what to check before a 76ers vs Wizards pick
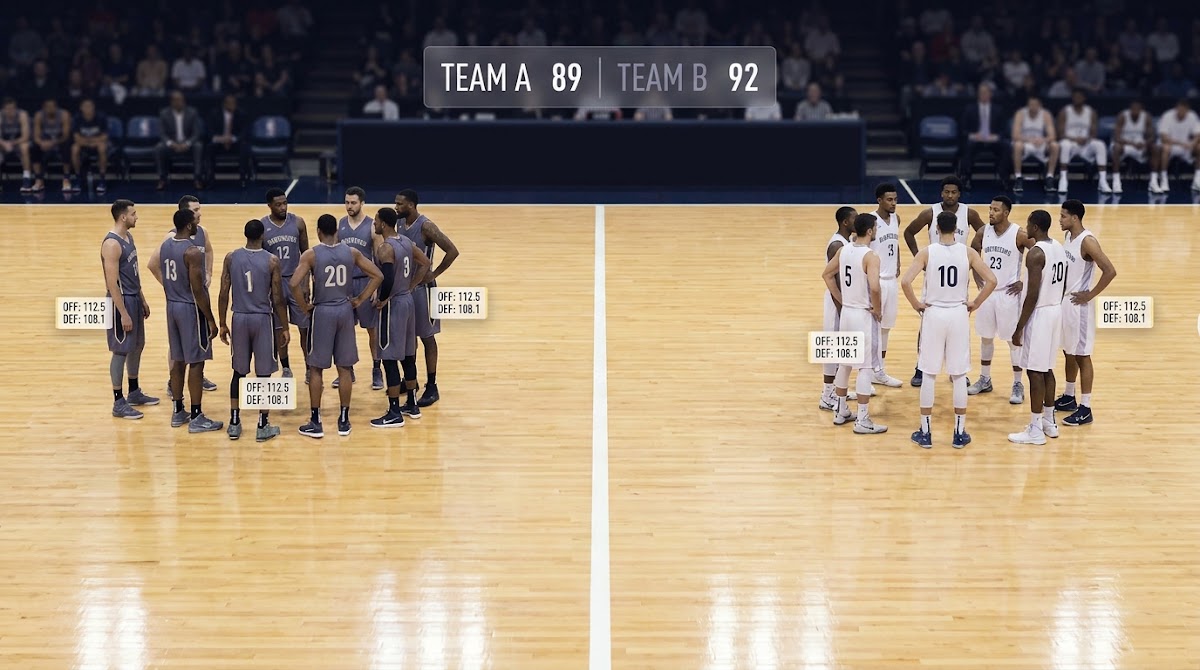
Short verdict: use efficiency over narrative. Focused comparisons of offensive rating, defensive rating and net rating are more reliable than raw win-loss records when forming a 76ers prediction; place those numbers into league context before deciding, for example via the Basketball-Reference season summary for 2025-26 to see where each team sits relative to the league.
Before you lock a view, run this quick checklist: check net rating, offensive rating, defensive rating and pace on the team pages, verify head-to-head results for the season, and consult the official NBA injury report on game day. The team pages on NBA.com provide the apples-to-apples box of metrics you need for those checks.

Why this order matters: net rating summarizes how a team performs per 100 possessions after accounting for both offense and defense, so it is the most concise single indicator of which team has been better on a possession basis this season.
Understanding the key metrics: net rating, pace and the Four Factors
Definitions first. Offensive rating measures points scored per 100 possessions and defensive rating measures points allowed per 100 possessions, while net rating is the difference between the two; pace is an estimate of possessions per 48 minutes and the Four Factors summarize the key efficiency drivers of offense and defense. These definitions and their intent are explained in the NBA Stats Glossary, which is the standard reference for comparing team efficiency.
Why net rating tends to be the best single baseline: it neutralizes tempo and gives a rate-based comparison that signals whether the team is generically better on offense than its opponent after adjusting for defense. For matchup work, start with net rating because it compresses offense and defense into one measure you can compare directly across teams.
How pace changes interpretation: two teams with similar net ratings can play very differently if one runs a much faster style and the other prefers half-court sets; that difference matters when you expect fatigue, substitutions or deliberate matchup exploitation. Use pace as an adjustment layer, not a replacement for net rating.
Reading the team pages on NBA.com: open the 76ers and Wizards 2025-26 regular season team pages to capture offensive rating, defensive rating, net rating, pace and the Four Factors in a single view, then use those figures as inputs to your comparison rather than relying on counting stats like points per game.

A step-by-step prediction framework using 2025-26 team efficiency and head-to-head data
Step 1: Start with net rating differential
Begin by calculating the net rating difference between the 76ers and the Wizards using the 2025-26 team pages, because net rating gives a direct efficiency gap per 100 possessions and is the clearest single signal to start a 76ers prediction.
Step 2: Adjust for pace and Four Factors - 76ers prediction
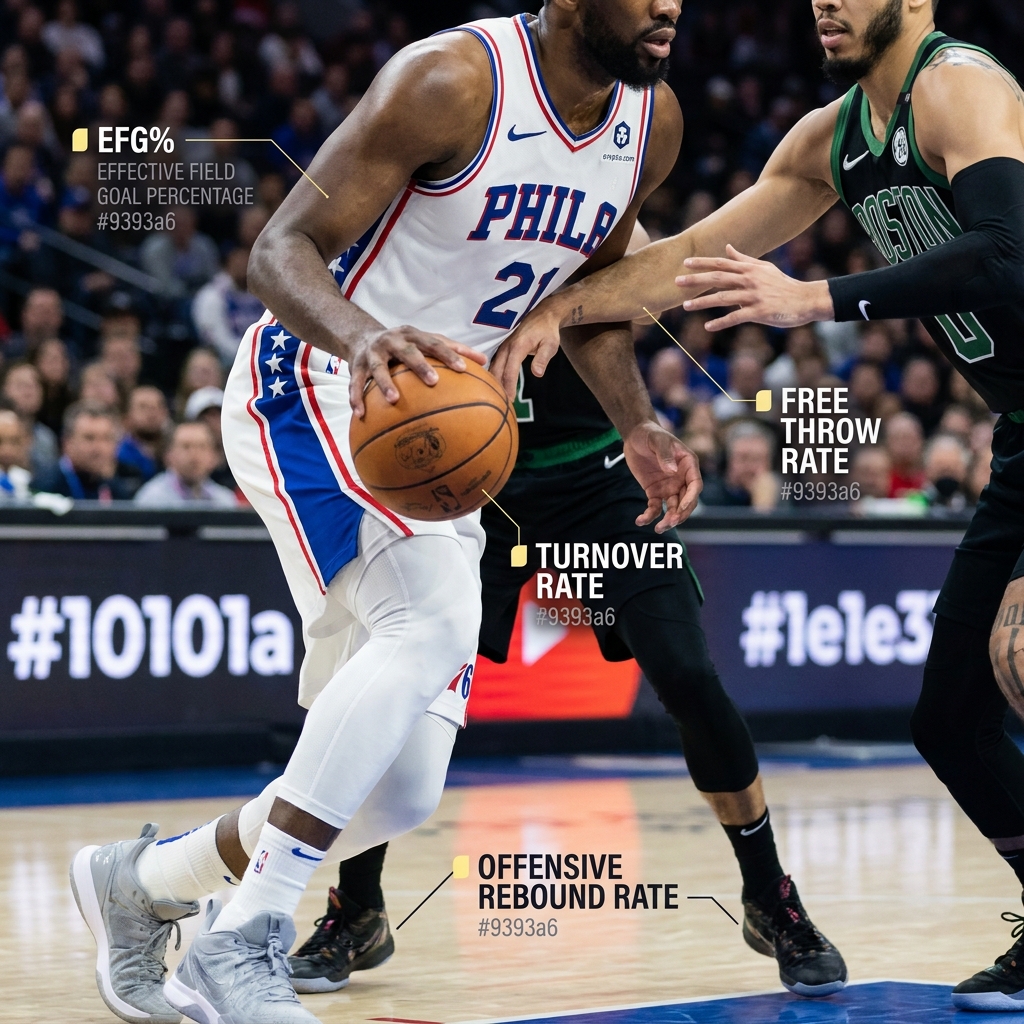
Next, compare pace and the Four Factors to see whether style or specific efficiency drivers could flip the basic net rating gap; turnovers, effective field goal percentage and rebound rates are the usual suspects that can cause the expected outcome to diverge from raw net rating.
Try the FundedPlays Challenges framework for structured prediction practice
Save this framework checklist and use it as your default pre-game review to ensure you check efficiency, pace and availability in the same order every time.
Step 3: Layer head-to-head and matchup nuances
Finally, consult the 76ers vs Wizards head-to-head page for the season to capture matchup-specific outcomes and patterns, then re-check the injury report and schedule context before committing to your final view.
Putting the steps in sequence helps you move from the broad efficiency signal to the fine-grained matchup effects in a consistent way, so your 76ers prediction is repeatable and defensible.
Head-to-head, schedule factors and injury availability: adjusting the baseline
Use the official head-to-head page on NBA.com to spot whether particular matchups or style contrasts caused anomalous results in the season sample; head-to-head can reveal matchup edges but should not replace efficiency comparisons.
Use net rating as the baseline, adjust for pace and the Four Factors, then verify head-to-head and game-day availability to form a final judgment.
Game-day checks matter: before taking a position, run a short schedule checklist for rest, travel and back-to-back status, and always consult the NBA’s official injury report on game day because missing or limited starters can overturn an efficiency-based expectation.
A practical decision checklist and weighting rules for final judgment
Which metrics get the most weight: start with net rating and recent sample efficiency as primary drivers, give secondary weight to Four Factors and pace adjustments, and count head-to-head and injury effects as situational modifiers that can add or subtract from the baseline score.
Sample weighting template you can copy: Net rating 45 percent, Recent sample efficiency 20 percent, Four Factors adjustments 10 percent, Pace and matchup style 10 percent, Head-to-head pattern 10 percent, Injury and availability 5 percent. Use the template as a starting point and keep it flexible for game-unique considerations.
Convert metrics and situational checks into a single actionable checklist
Use this to keep your final call consistent
How to fold the pieces together: convert each input into a directional adjustment, apply the weights and produce a comparative score; if the weighted score margin is small, treat the result as a coin-flip and prioritize availability and market moves rather than forcing a confident pick.
Common mistakes and how to avoid them when comparing the Wizards and 76ers
Over-relying on win-loss record is common but risky because record can hide strength of schedule, rest patterns and luck; net rating and league benchmarking show performance on a per-possession basis that is less sensitive to those noise sources.
Misreading pace or small samples is another frequent error; short-term trends can mislead if they are driven by a single player returning from injury or a fluke shooting stretch. Treat the Four Factors as meaningful only after they hold over a sample large enough to reduce random variance.
Corrective habits: check the NBA Stats Glossary when a metric definition is unclear, compare team metrics against the Basketball-Reference season summary for league context, and always confirm availability on the official injury report before finalizing judgment.
Worked scenarios using 2025-26 data and a final, balanced takeaway
Scenario A, both teams healthy: start from the 2025-26 team pages to pull net rating and Four Factors, apply the weighting template and, if the 76ers show a clear net rating advantage after adjustments, prefer the 76ers while noting that matchup and pace may narrow margins for a single game.
Scenario B, key 76ers player unavailable: a significant absence on Philadelphia can change the baseline quickly; in that case, treat the injury adjustment as a larger negative and escalate the impact in the weighted score while verifying head-to-head tendencies for similar absences.
Balanced takeaway: metrics give you structure and discipline but not certainty; use net rating, pace, Four Factors, head-to-head and the injury report together to form a reasoned 76ers prediction, and accept that availability and short-term noise can change the result in either direction.
Net rating is the most concise single metric because it combines offensive and defensive performance into a per-100 possessions measure and is a good starting point for comparisons.
Availability can materially change a projection, especially if a starter or primary playmaker is ruled out, so always consult the official game-day injury report before finalizing a view.
Use head-to-head results as a tiebreaker or a source of matchup nuance, but prioritize season efficiency metrics for the baseline judgment.
References
- https://www.basketball-reference.com/leagues/NBA_2026.html
- https://www.nba.com/stats/teams/advanced
- https://www.espn.com/nba/game/_/gameId/401810960/76ers-wizards
- https://www.fundedplays.com/blogs/how-fundedplays-evaluations-work
- https://www.fundedplays.com/blogs
- https://www.fundedplays.com
- https://www.fundedplays.com/challenges