
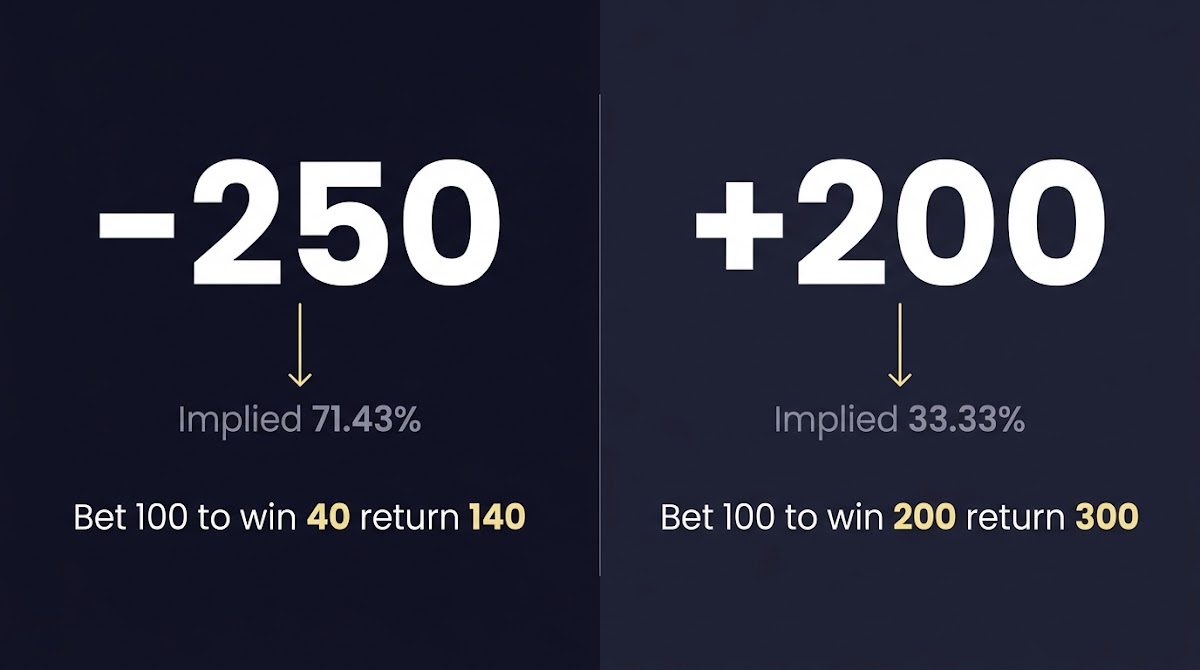
American odds explained: what 200 odds and -250 odds express
American odds use a plus or minus sign to show price and quick payout thinking, so you can read a line and know who is the favorite and who is the underdog. For example, 200 odds mean a positive American price where a 100 stake would win 200 in profit, while a negative number like -250 marks a favorite and shows how much you must risk to win 100; this notation is the standard moneyline format for U.S. markets, and a readable primer appears in Investopedia's implied probability guide Investopedia implied probability guide.
That compact notation is useful because it turns a line into an immediate mental calculation of profit and implied chance. The minus sign identifies the favorite and tells you the stake required to win 100, while the plus sign identifies the underdog and tells you how much you win on a 100 stake. Readers who want fast comparisons often prefer this moneyline view because it links payout and likelihood in one short number.
In practical terms, seeing 200 odds on a market should cue you that the outcome pays out double your stake on a 100 unit bet, and seeing -250 should cue you that the market expects the outcome to be materially more likely than a 50 percent event. Later sections show the step-by-step math for converting those prices into implied probability and for computing profit and return, so you can check lines and plan staking with confidence.
Learn the conversion formulas and test them in the FundedPlays Challenges description
Continue to the conversion examples below to see the exact formulas and worked numbers, including how -250 converts into an implied probability and how 200 odds pay out.
What minus 250 odds mean: reading negative American odds
Negative American odds are simply the amount you must risk to win 100, written with a minus sign to show a market favorite. Put plainly, -250 means stake 250 to win 100 in profit, which many readers find easier to scan as "stake 250 to win 100" when comparing options on a card; this is the standard interpretation explained in FanDuel's odds help article FanDuel how to read betting odds.
Bookmakers display favorites with a minus to indicate a lower payout per dollar and a higher implied chance of winning. That structure helps bettors quickly separate lower-return, higher-probability plays from higher-return, lower-probability underdogs when skimming lines or building simple models.
Converting American odds to implied probability (with -250 and 200 odds examples)
There are two standard one line formulas for converting American odds to implied probability. For negative odds you use p = |odds| / (|odds| + 100). For positive odds you use p = 100 / (odds + 100). These formulas are commonly taught in betting education resources and calculators, and the derivation and uses are covered in Action Network's guide to implied probability Action Network implied probability guide.
Minus 250 means you must risk 250 to win 100; it implies about a 71.43 percent chance before adjusting for sportsbook margin.
Apply the negative formula to -250: take the absolute value 250 and compute 250 divided by 250 plus 100. That is 250 / 350, which equals 0.714285..., so -250 implies about 71.43 percent implied probability. This numeric interpretation tells you how the market is pricing the chance of the outcome, before any normalization for bookmaker margin.
Now apply the positive formula to 200 odds. Use p = 100 / (odds + 100). Plug in 200 and compute 100 / 300, which equals 0.33333..., so 200 odds correspond to roughly 33.33 percent implied probability. Comparing the two results helps clarify why -250 reads as a strong favorite and 200 reads as a modest underdog with much higher payout per unit stake.

Payout math: calculating returns for -250 and +200
Payout formulas follow directly from the American odds notation. For negative odds the profit on a stake is profit = stake times 100 divided by the absolute odds value. For positive odds the profit is profit = stake times odds divided by 100. These payout rules and example calculations are summarized in beginner guides such as TheLines odds explainer TheLines implied probability explanation.
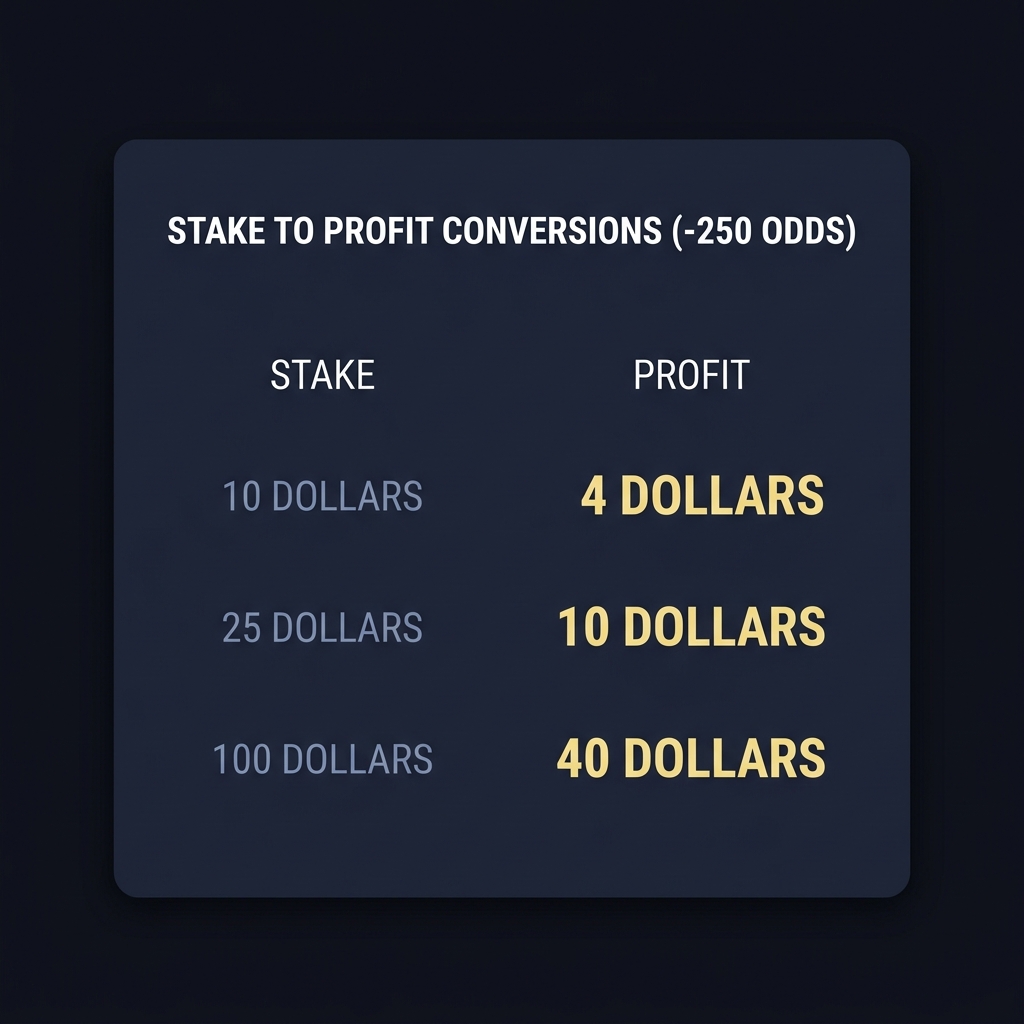
Using the negative formula for -250, profit = stake * (100 / 250). That reduces to profit = stake * 0.4. So a 10 stake returns 4 profit and a 14 total return including stake. A 25 stake returns 10 profit and 35 total. A 100 stake returns 40 profit and 140 total. These numbers come directly from applying the formula to common stakes and show the small per-bet profit that favorites offer.
For +200, apply the positive formula profit = stake * (odds / 100). That is profit = stake * 2. A 10 stake returns 20 profit and 30 total. A 25 stake returns 50 profit and 75 total. A 100 stake returns 200 profit and 300 total. These larger per-bet profits for underdogs illustrate the trade-off between reward and implied likelihood.
Risk, reward and variance: why -250 is a favorite and +200 is higher variance
A core trade-off when reading lines is that favorites like -250 have higher implied probability and produce smaller profits per stake, which reduces short-term variance compared with backing underdogs. The comparative math that shows +200 pays more per stake but at a lower implied chance of winning is covered in odds education such as TheLines and Action Network resources TheLines implied probability explanation.
For bankroll planning, that difference matters: repeated small wins from favorites tend to make variance more predictable, while occasional large wins from underdogs create volatile bankroll trajectories. A neutral, disciplined approach weighs the edge you believe you have versus the variance you can tolerate, and uses position sizing rules to reflect that balance.

Accounting for sportsbook margin (vig) when comparing lines
Posted sportsbook odds include a margin, often called the vig, so implied probabilities taken straight from prices will generally sum to more than 100 percent across a market. Pinnacle's explanation of normalization and margin effects describes how the bookmaker margin inflates summed implied probabilities and why you should correct for it when comparing lines Pinnacle margin and implied probability.
To compare lines or to determine value, traders often normalize the market probabilities by dividing each implied probability by the sum of probabilities so they add to 100 percent. That produces a set of margin-adjusted probabilities which are easier to compare with your own forecast, though the exact normalization method and its accuracy vary with market depth and how many outcomes exist in the market.
Practical staking examples: $10, $25, $100 at -250 and +200
Worked numeric examples help make the formulas practical. For -250, use profit = stake * 0.4. So a 10 stake wins 4 profit and returns 14. A 25 stake wins 10 profit and returns 35. A 100 stake wins 40 profit and returns 140. These are direct, repeatable calculations that you can do quickly when scanning a card.
Quick profit calculator for American odds
Use whole dollar inputs
For +200, use profit = stake * 2. A 10 stake wins 20 profit and returns 30. A 25 stake wins 50 profit and returns 75. A 100 stake wins 200 profit and returns 300. Laying out these parallel examples side by side makes the difference in risk profile and return immediate when planning stake sizes or setting expectations for short-term bankroll movement.
As a short mental accounting note, favorites like -250 often require you to think in smaller units because profit per bet is modest. Underdogs at +200 make single-bet outcomes swing more, so many players reduce stake size when chasing underdog value to manage variance.
Common mistakes when interpreting odds and probability
A common beginner error is mixing up profit and total return. Profit is the amount you gain above your stake, while return includes the stake. For example, saying a 100 stake at -250 returns 40 is incorrect; the profit is 40 and the total return is 140. Clarifying this distinction prevents calculation errors when tallying results.
Another frequent mistake is treating implied probability as if it were the true probability without adjusting for sportsbook vig or market inefficiencies. Implied probability reflects market price, not a perfect objective chance, so it is wise to normalize for margin before comparing market-implied numbers to your own forecast or model; Pinnacle covers these caveats in their probability resources Pinnacle margin and implied probability.
People also misread signage, forgetting that a minus denotes the stake required to win 100 while a plus denotes profit on a 100 stake. Double checking the sign and recomputing a quick example solves most of these errors.
Using implied probability in simple models and comparisons
Implied probability is useful for quick expected value checks and market comparisons because it converts price into a common probabilistic scale. Use these market-derived probabilities to compare against your own forecast and compute basic expected value, remembering to normalize for vig first to avoid overestimating market-implied certainty.
For a quick expected value test, compute your forecast probability for an event, compare it to the normalized market probability, and multiply the difference by the potential profit to see whether a bet offers positive expected value. This lightweight check helps spot apparent value without building complex models and is a reasonable early filter for deciding whether to dig deeper into a line.
When odds move: interpreting line changes for -250 and +200
Odds move when information, money flow, or bookmaker risk management causes bookmakers to adjust prices. A shift from -250 to -280 increases the implied probability and reduces the per-bet profit, while a move the other way to -230 reduces implied probability and increases profit for backers. TheLines and sportsbook educational content explain how stake imbalances and new information drive movement TheLines implied probability explanation.
Line movement can signal new injury information, heavy betting on one side, or adjustments to balance liability. Rather than reflexively following a move, track whether the change aligns with your own information edge and whether the new price still meets your expected value criteria.
Comparing American odds to decimal and fractional formats
Converting to decimal odds helps some readers because decimals include the stake in the multiplier. To convert American negative odds to decimal, use decimal = 1 + 100 / |American Odds|. For -250, decimal = 1 + 100 / 250 = 1.4. For positive American odds use decimal = 1 + American Odds / 100. For +200, decimal = 1 + 200 / 100 = 3.0. These conversions make it straightforward to compute total returns by multiplying stake by the decimal number.

Fractional equivalents are also simple checks: -250 corresponds to fractional 2/5 in typical fractional notation because the profit 100 on stake 250 simplifies to 2 on 5, while +200 corresponds to fractional 2/1 since 200 profit on 100 stake is the same as two to one. Learning these quick conversions can help when sites or tools display different formats.
Decision criteria: when to take a -250 favorite or look for +200 value
When considering a -250 favorite, check whether your model probability comfortably exceeds the implied probability after adjusting for vig. If you believe the true chance is materially higher than the margin-normalized market number, backing the favorite may offer positive expected value despite low per-bet profit. Action Network's conversion guides and expected value basics are helpful references for this logic Action Network implied probability guide.
Seek +200 value when you have niche information, identify market inefficiencies, or your model projects a higher chance than the normalized market probability. Because underdogs pay more, small differences in assessed probability can translate into attractive expected value, but be mindful of higher variance and adjust staking accordingly.
Realistic expectations and bankroll notes when betting favorites and underdogs
Favorites generate smaller per-bet profits, so a strategy of consistently backing favorites requires either high confidence frequency or a genuine edge to compound returns over many bets. Expect modest wins per successful wager and focus on disciplined staking rules to manage the slower growth profile.
Underdog strategies yield larger payouts on wins but carry higher volatility. Whichever style you choose, use position sizing that reflects both your assessed edge and your personal risk tolerance. No platform or market guarantees returns, and disciplined bankroll management remains the primary tool for surviving losing runs and capturing long-term edge.
Quick recap: key formulas and takeaways for -250 and 200 odds
Negative odds formula: p = |odds| / (|odds| + 100). Positive odds formula: p = 100 / (odds + 100). These two one-line formulas let you convert any American odds into implied probability.
Payout rule: for negative odds profit = stake * (100 / |odds|). For positive odds profit = stake * (odds / 100). Remember to include the stake when computing total return. Also remember that posted odds include sportsbook vig, so normalize market probabilities before comparing them to your own forecasts.
Further reading and references
Authoritative resources for these formulas and cautions include Investopedia, Action Network, TheLines, Pinnacle, FanDuel, and DraftKings; these pages explain implied probability, payout calculations, and how margin affects market probabilities. Checking an implied probability calculator or sportsbook help pages can provide quick validation of the numbers shown above.
For practical checks and tools, use reputable calculators like Omni Calculator and the bookmaker help sections that document how they display odds. Keeping these references in mind helps verify conversions and understand how markets embed margin into posted prices.
Use p = |odds| / (|odds| + 100). For -250 that is 250 / 350, about 71.43 percent.
At 200 odds profit = stake * 2, so a 10 stake wins 20 profit and returns 30 total.
No, posted odds include a margin, so implied probabilities should be normalized before comparing to an objective forecast.
References
- https://www.investopedia.com/terms/i/implied-probability.asp
- https://www.fanduel.com/research/how-to-read-betting-odds
- https://www.actionnetwork.com/education/implied-probability
- https://www.thelines.com/odds/implied-probability/
- https://www.fundedplays.com/challenges
- https://www.pinnacle.com/en/betting-articles/betting-strategy/how-to-calculate-implied-probability/2JE8ZHD47A2E23EZ
- https://oddsjam.com/betting-calculators/implied-probability
- https://www.aceodds.com/bet-calculator/odds-converter.html
- https://www.omnicalculator.com/statistics/implied-probability
- https://www.fundedplays.com
- https://www.fundedplays.com/blogs
- https://www.fundedplays.com/blogs/how-fundedplays-evaluations-work